Survey Data

![]()
![]()
![]()
![]()
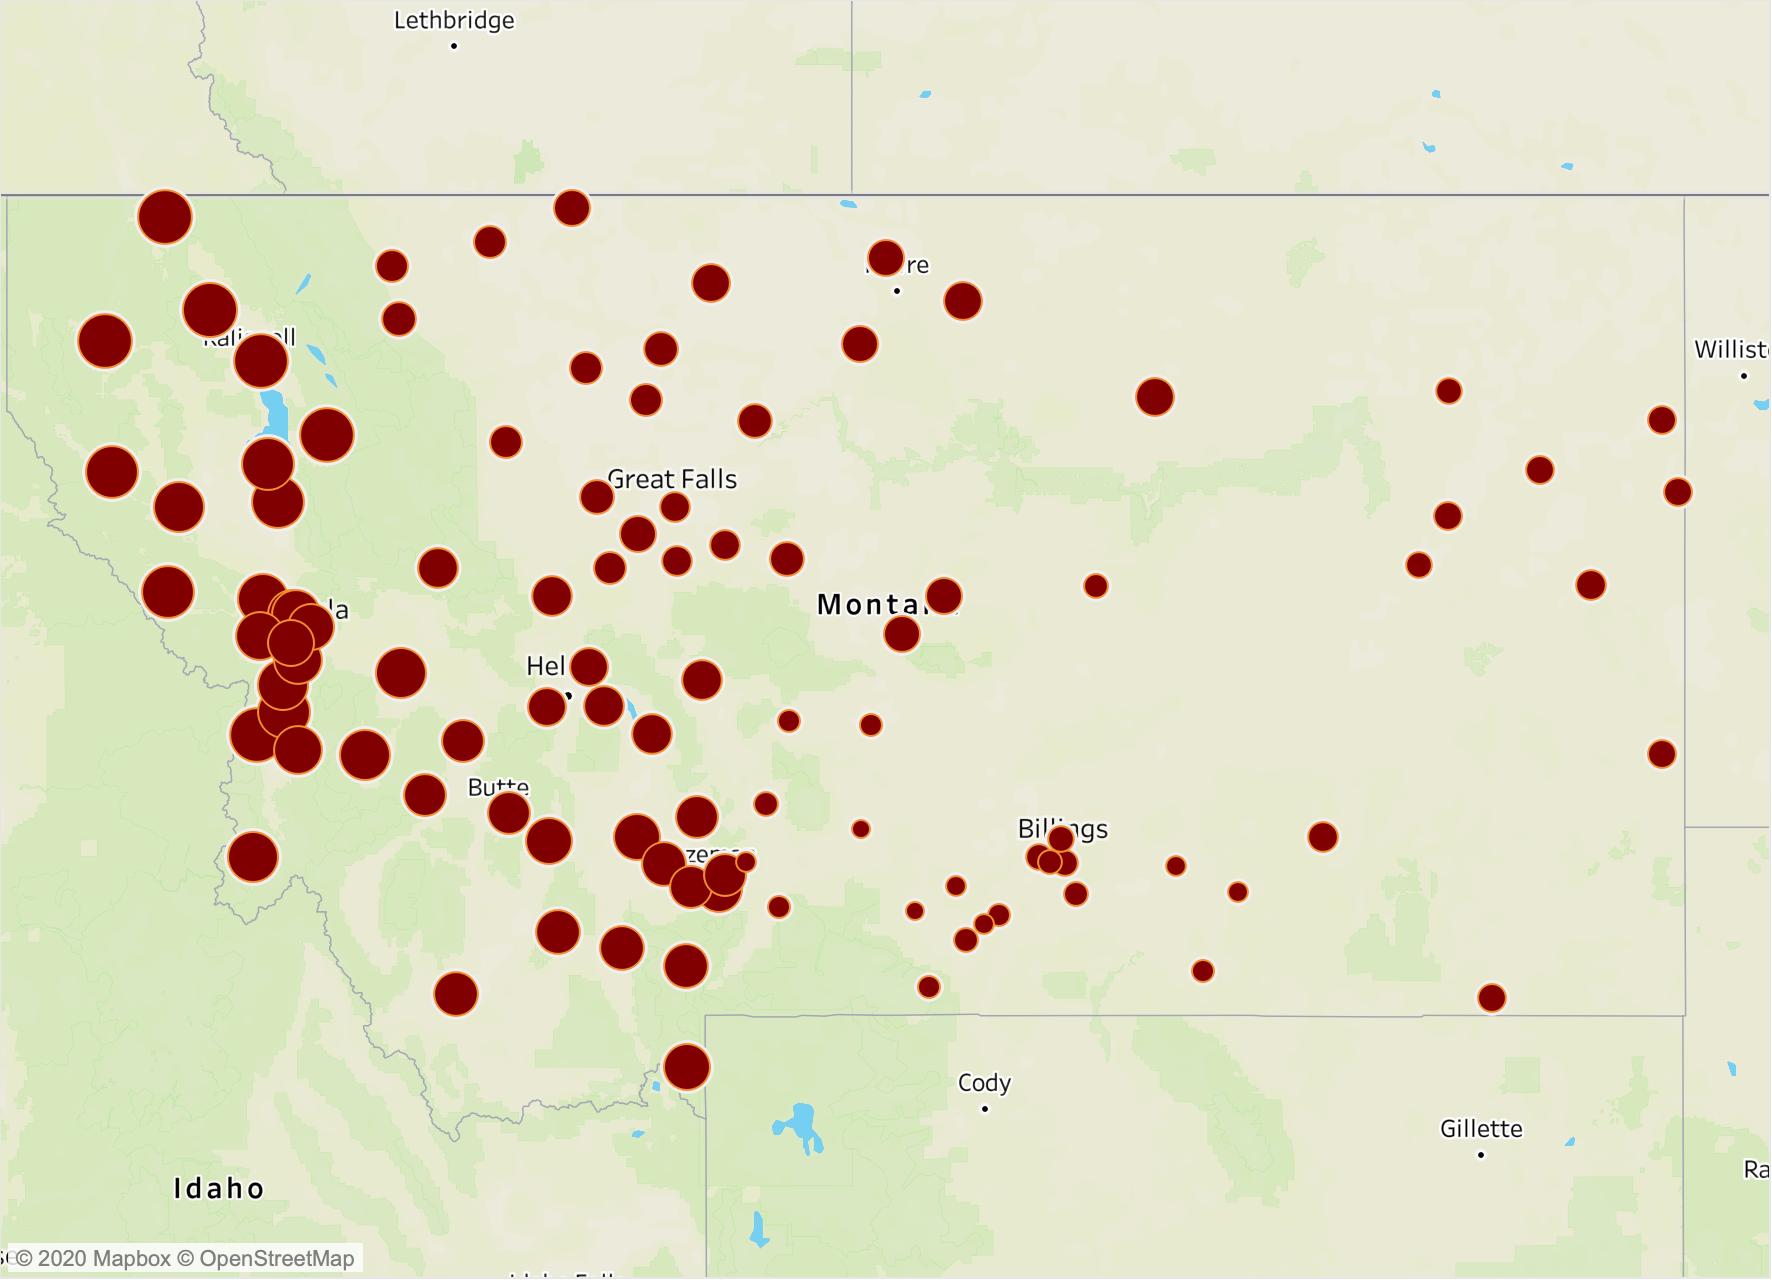 Density of Survey Responses by ZIP Code (N=787)
Overview Description of Surveys
Two surveys were designed to understand the decision-making processes of information exchange among Montanans in the digital area.
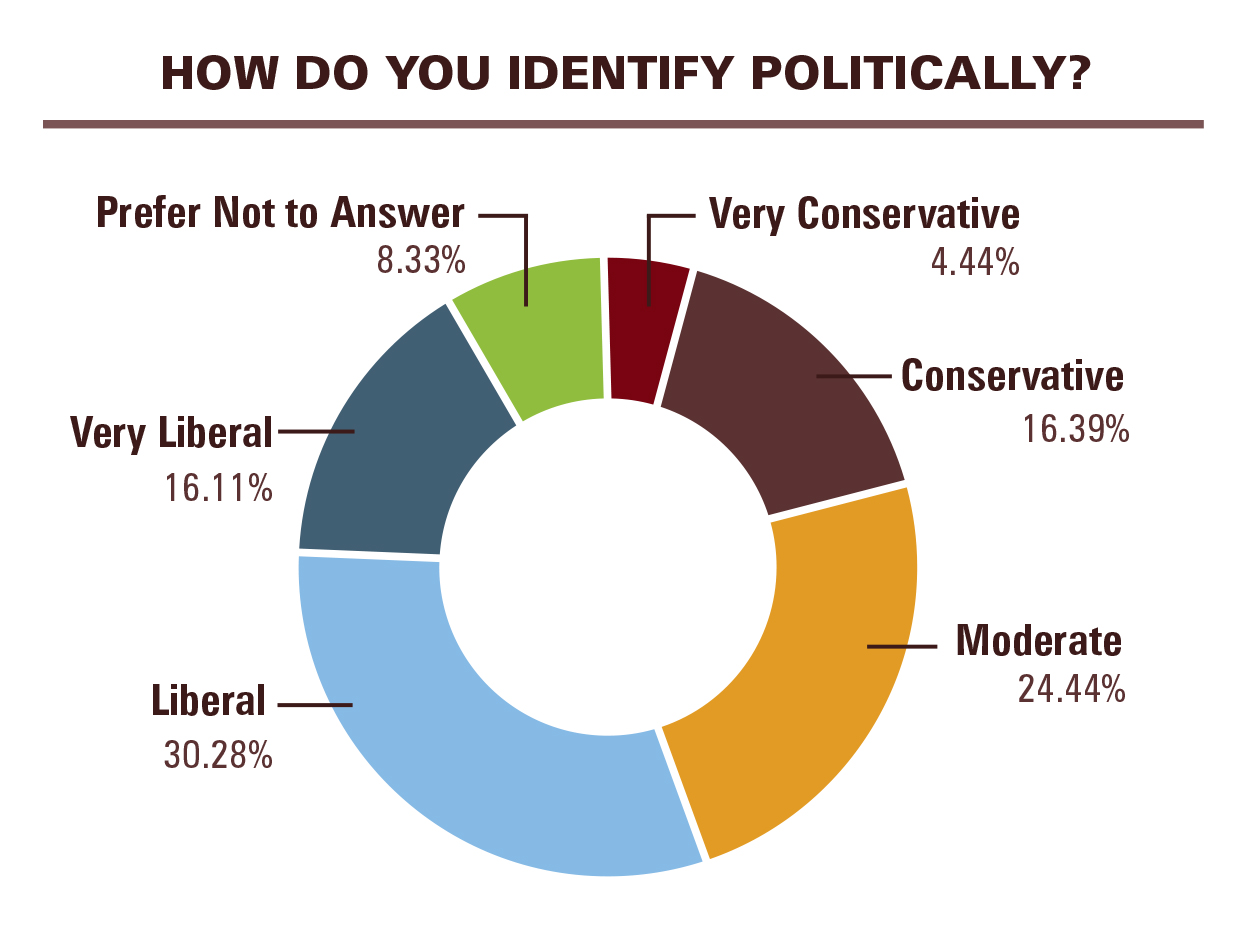
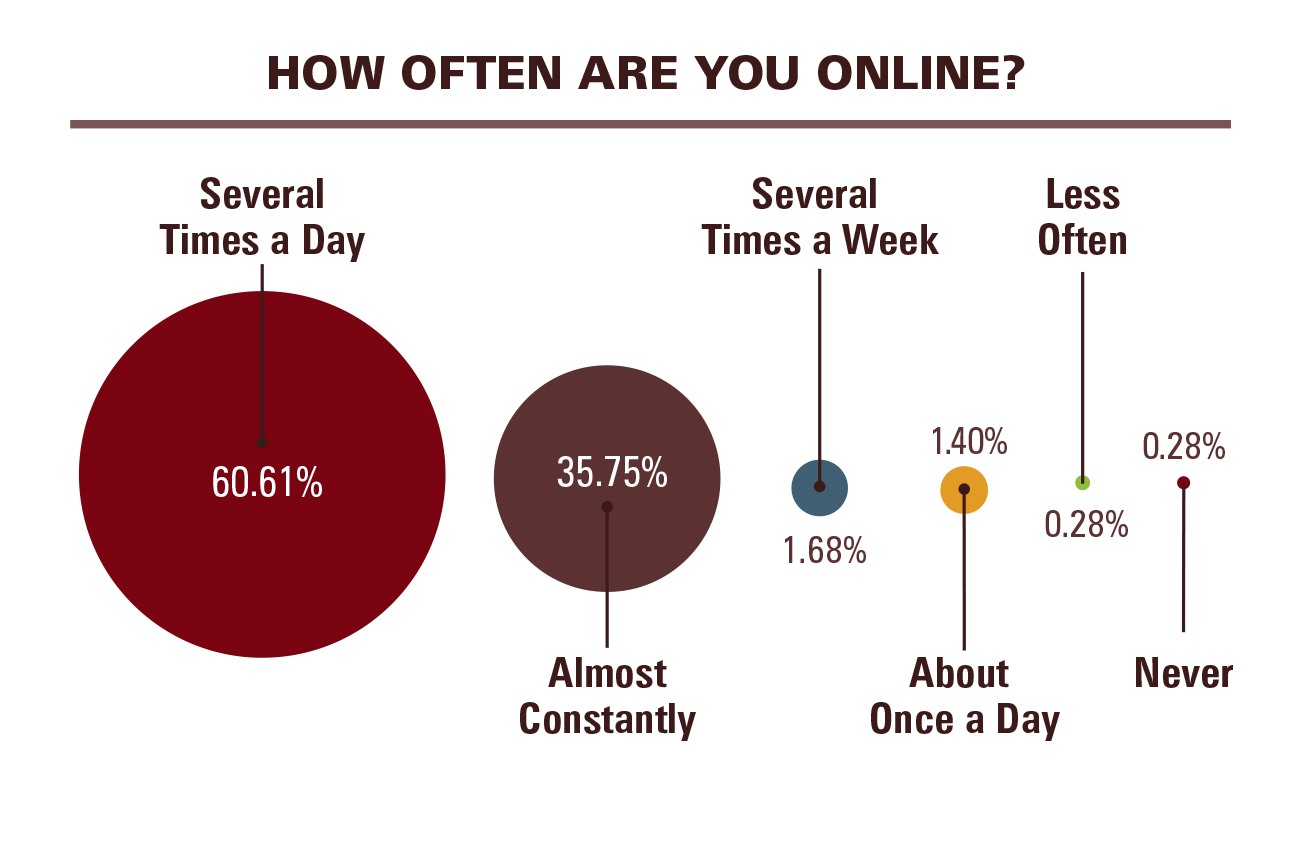
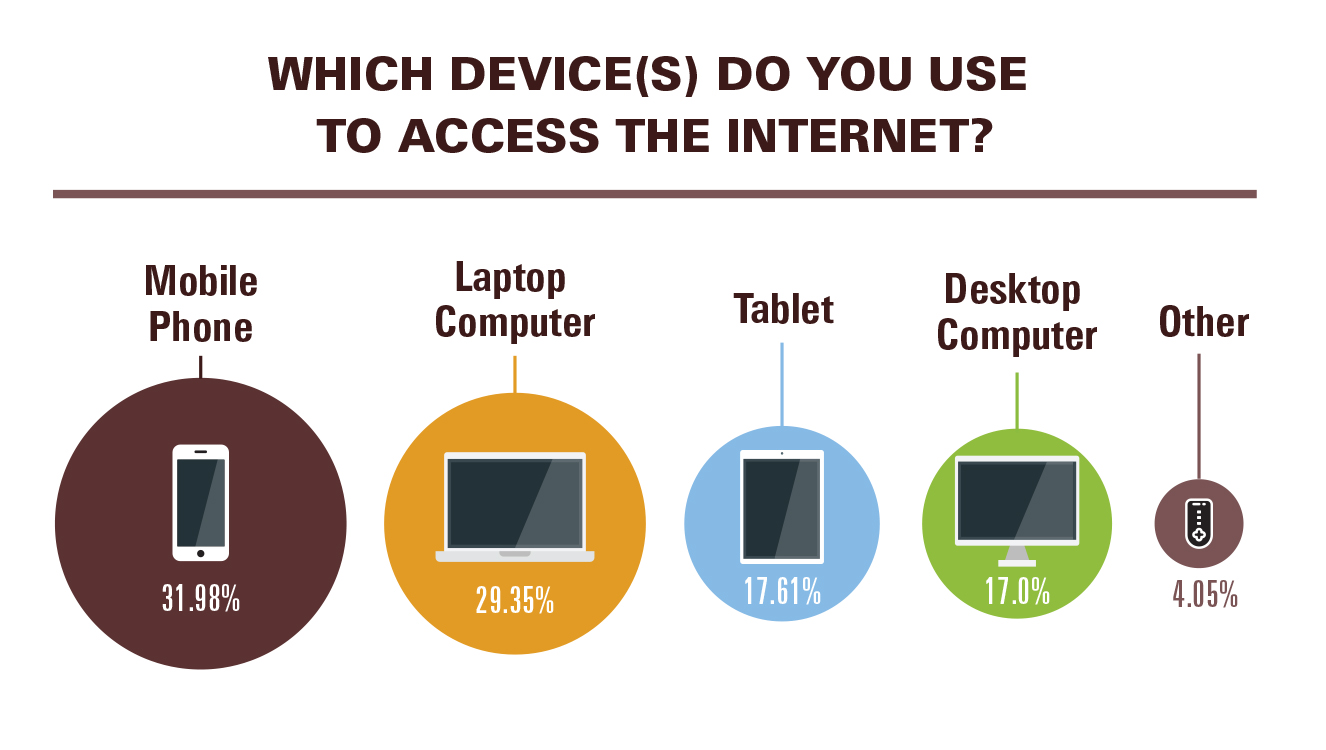
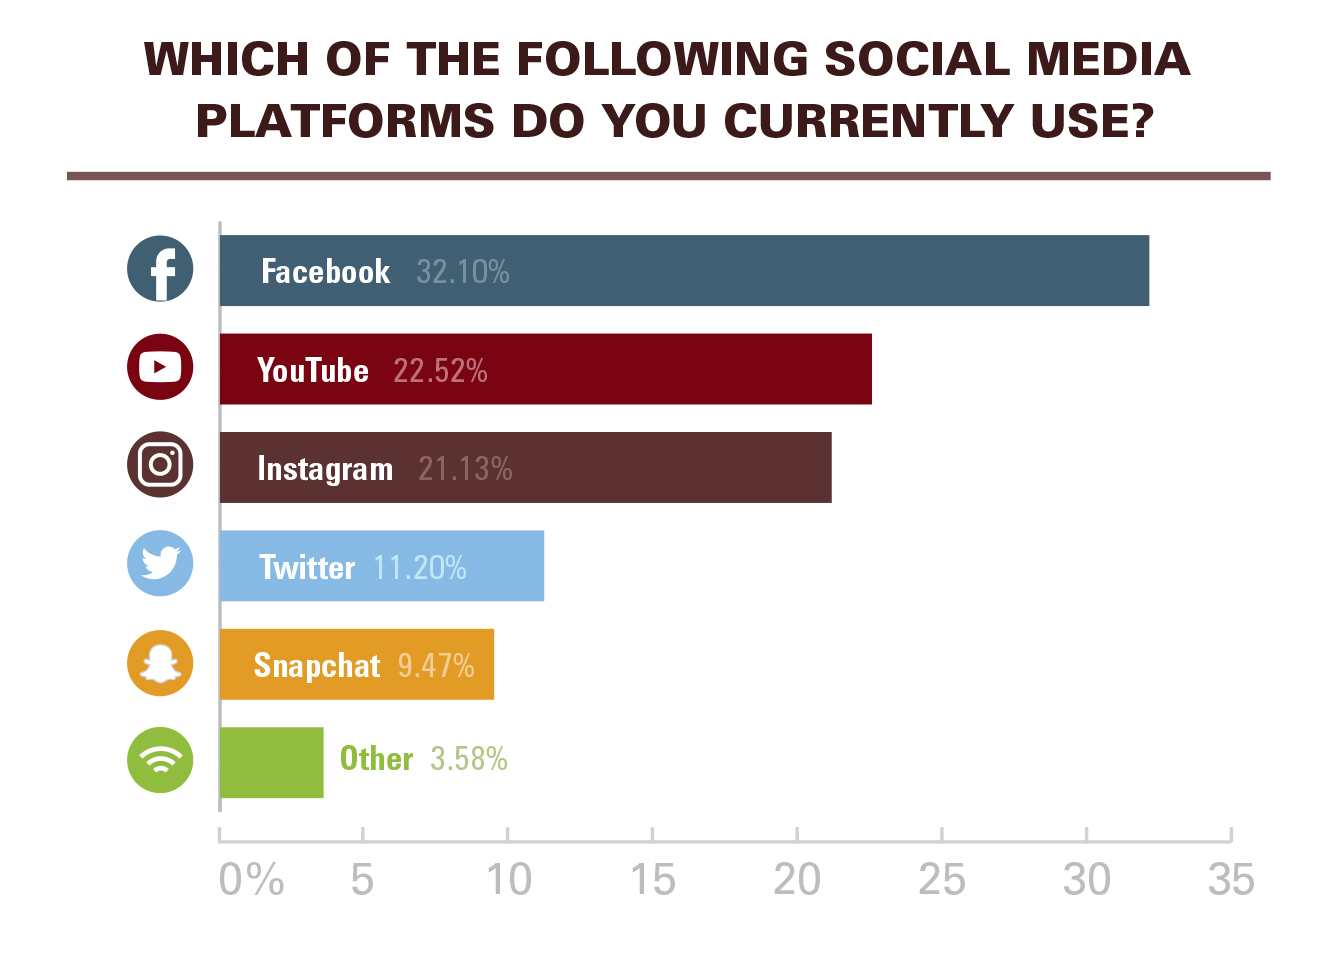
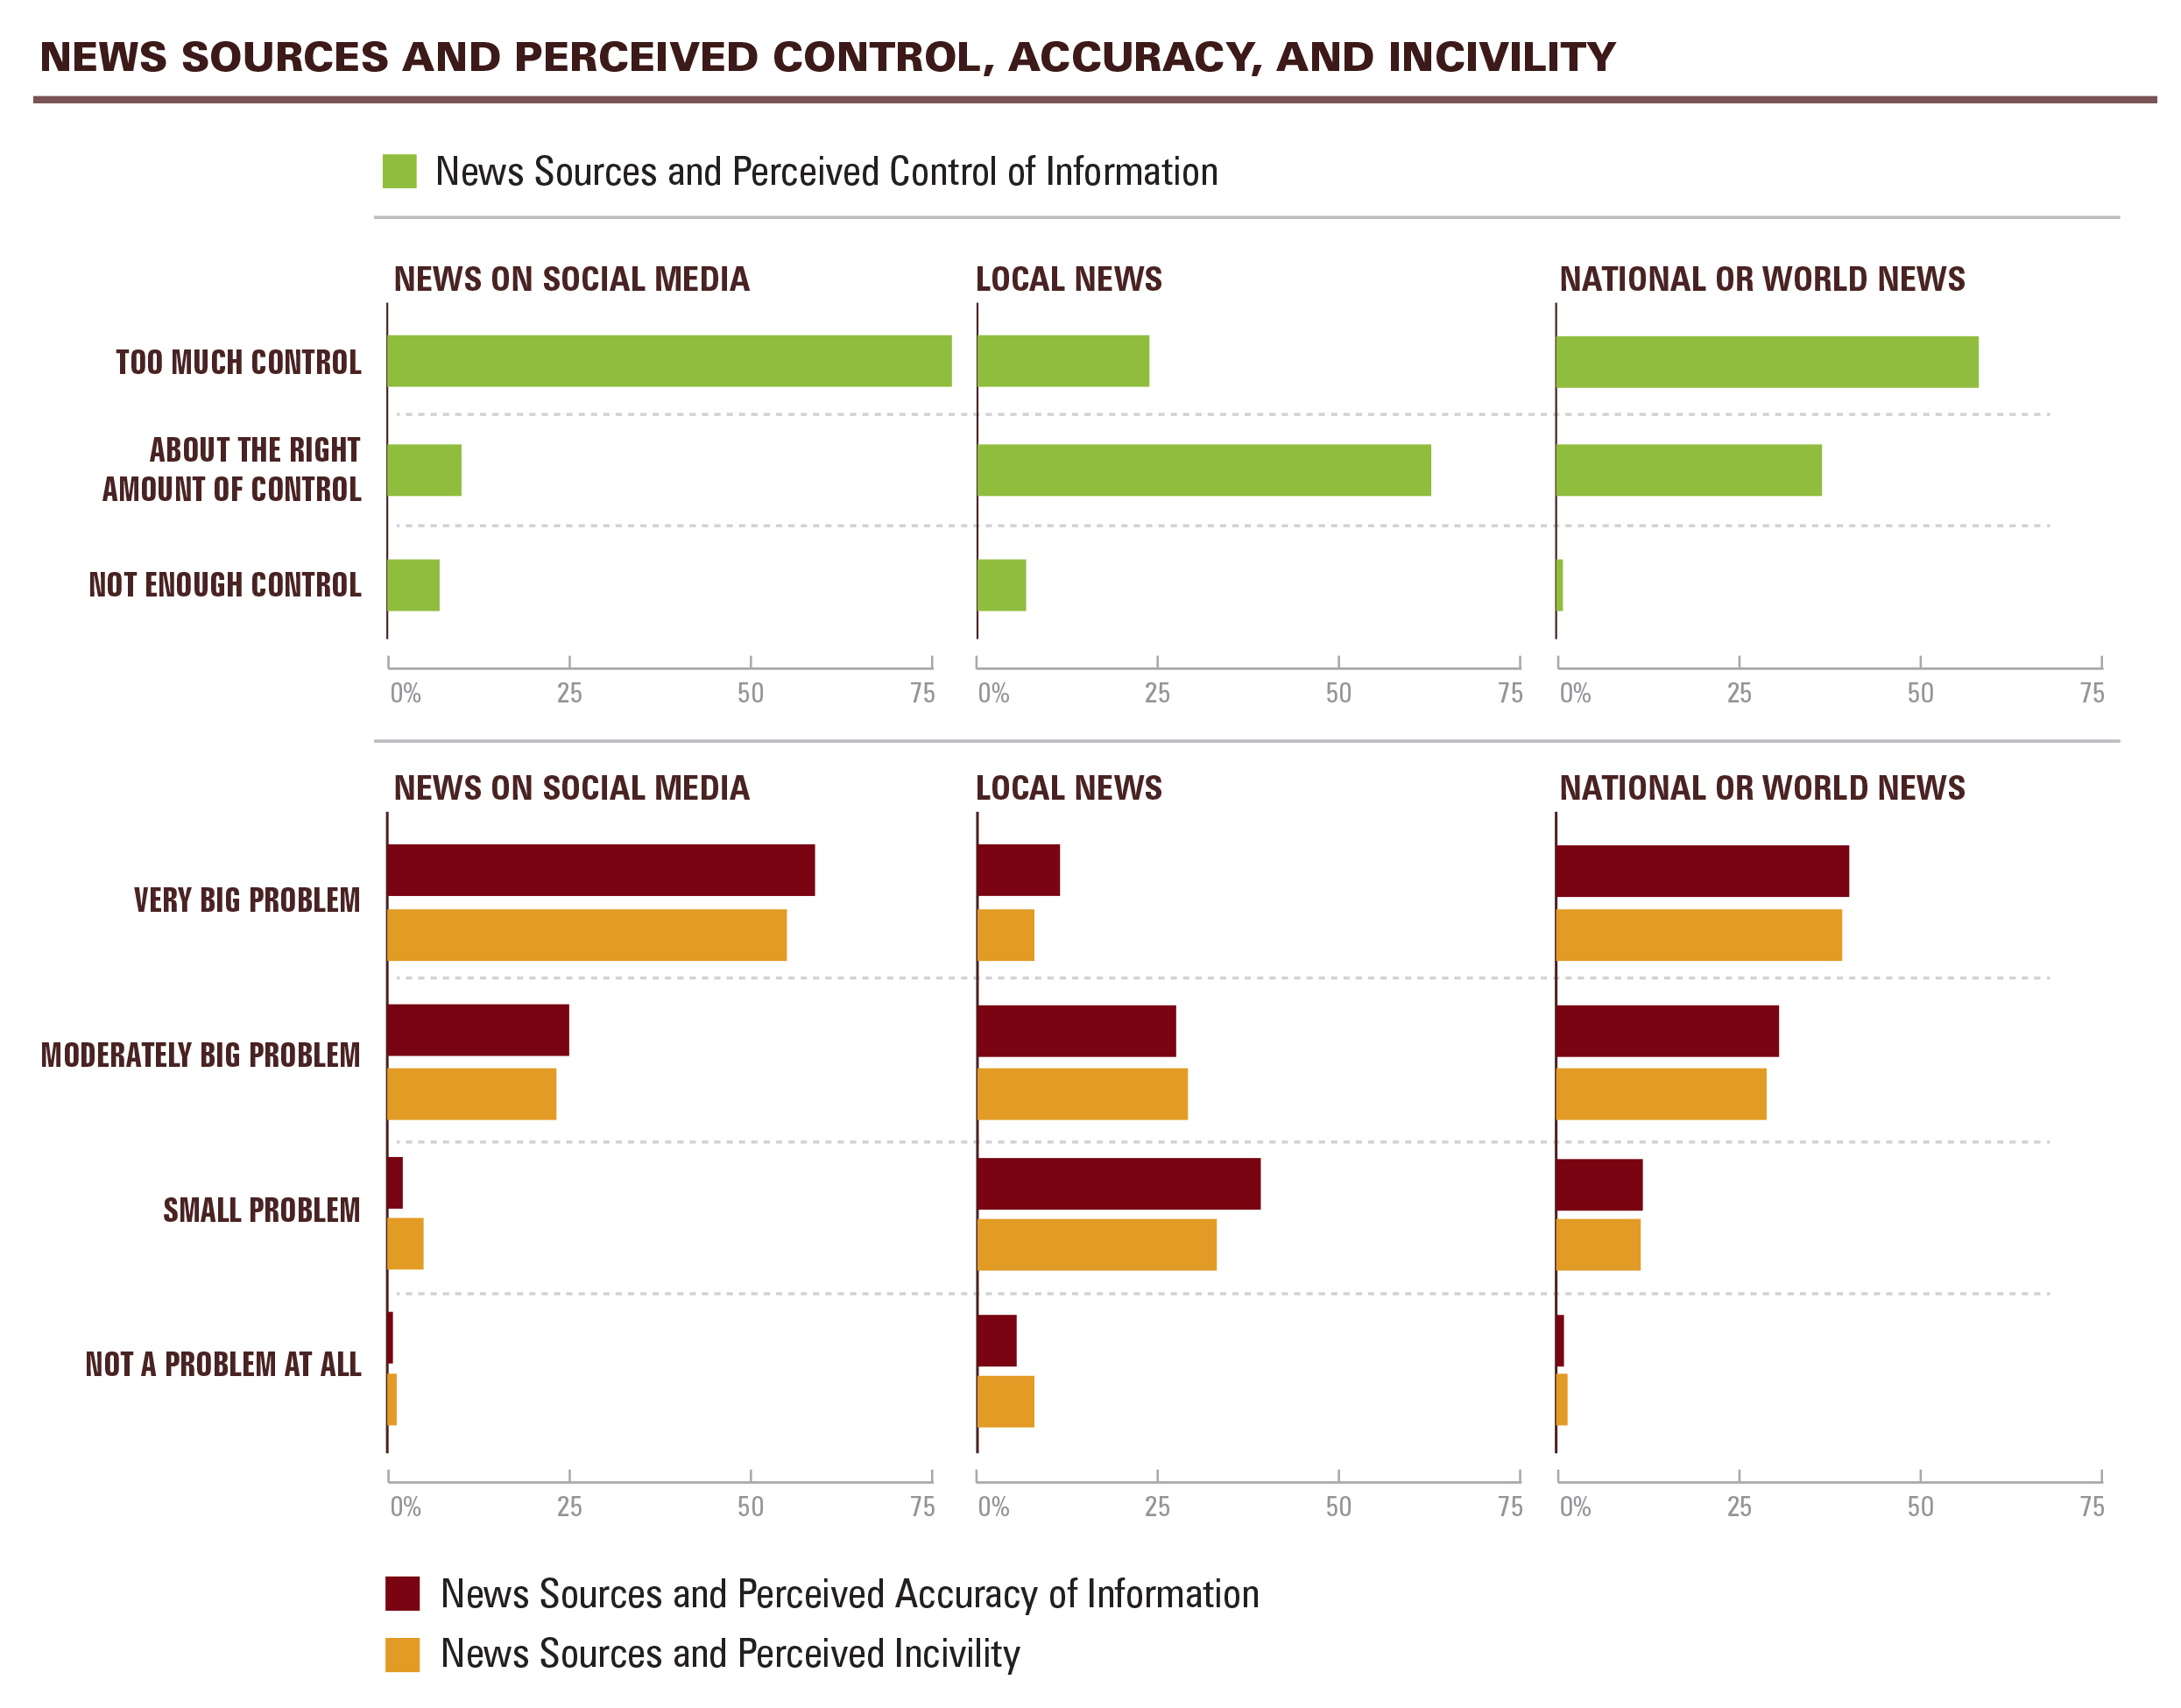
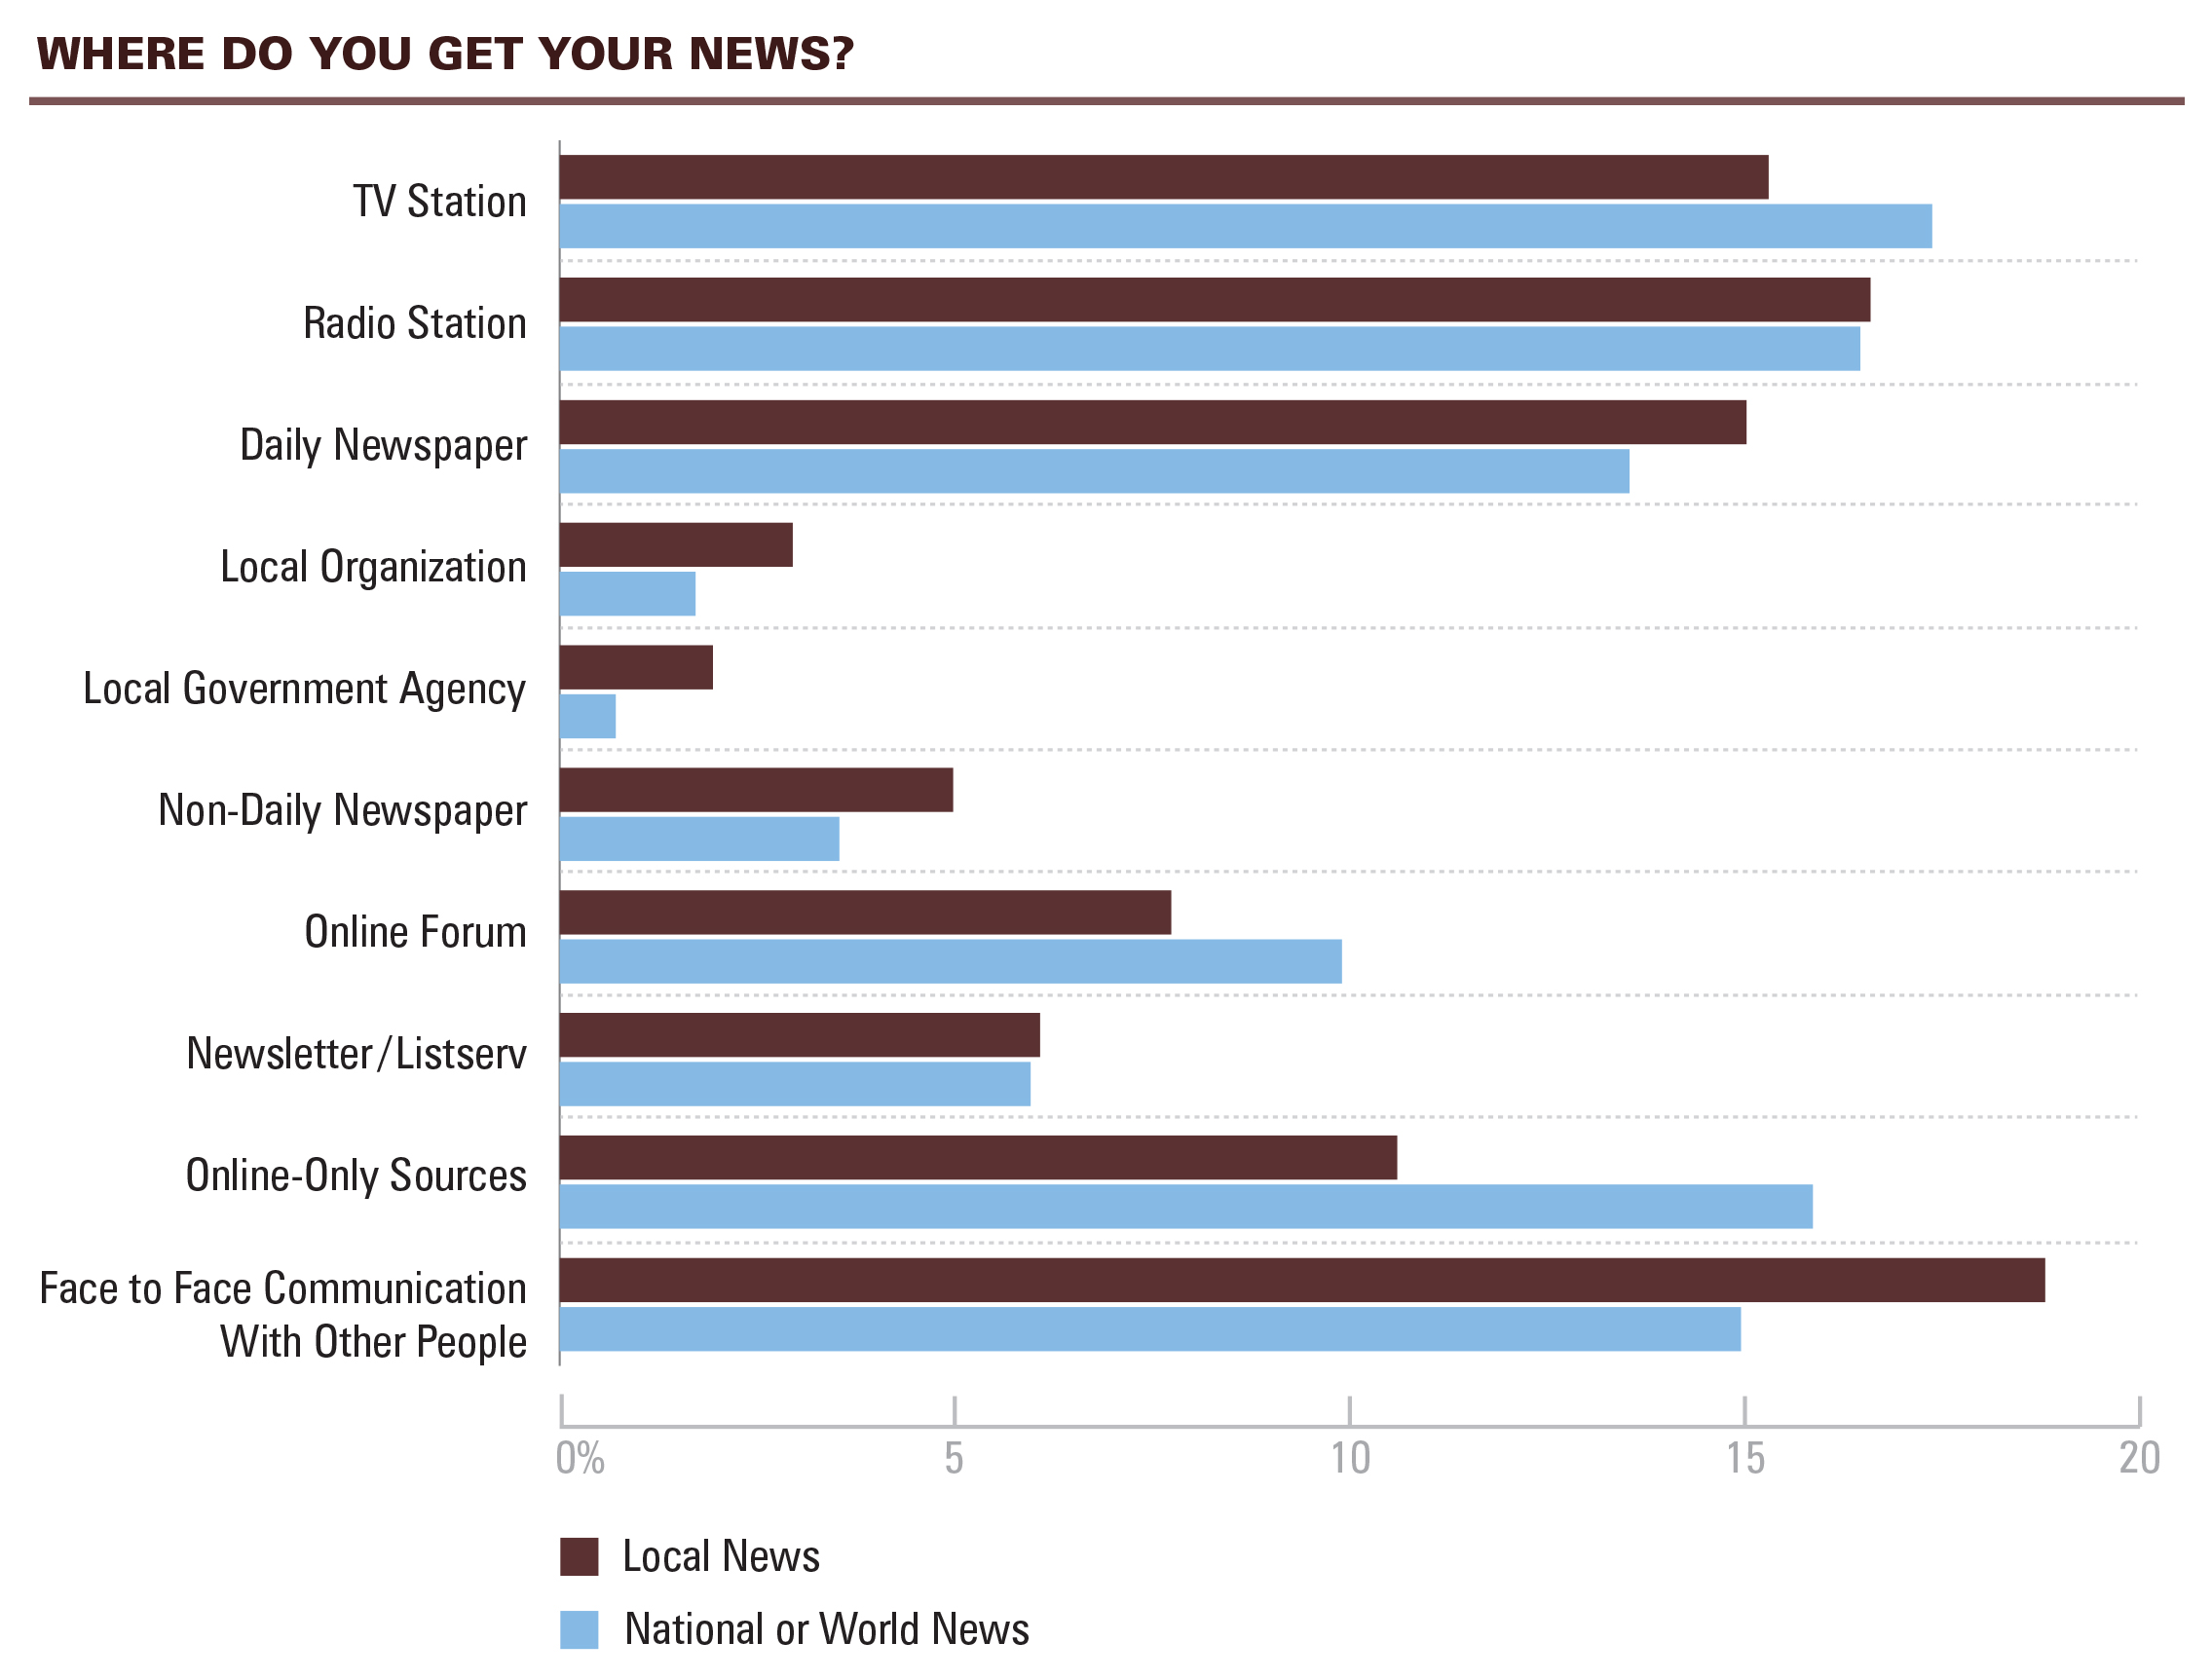
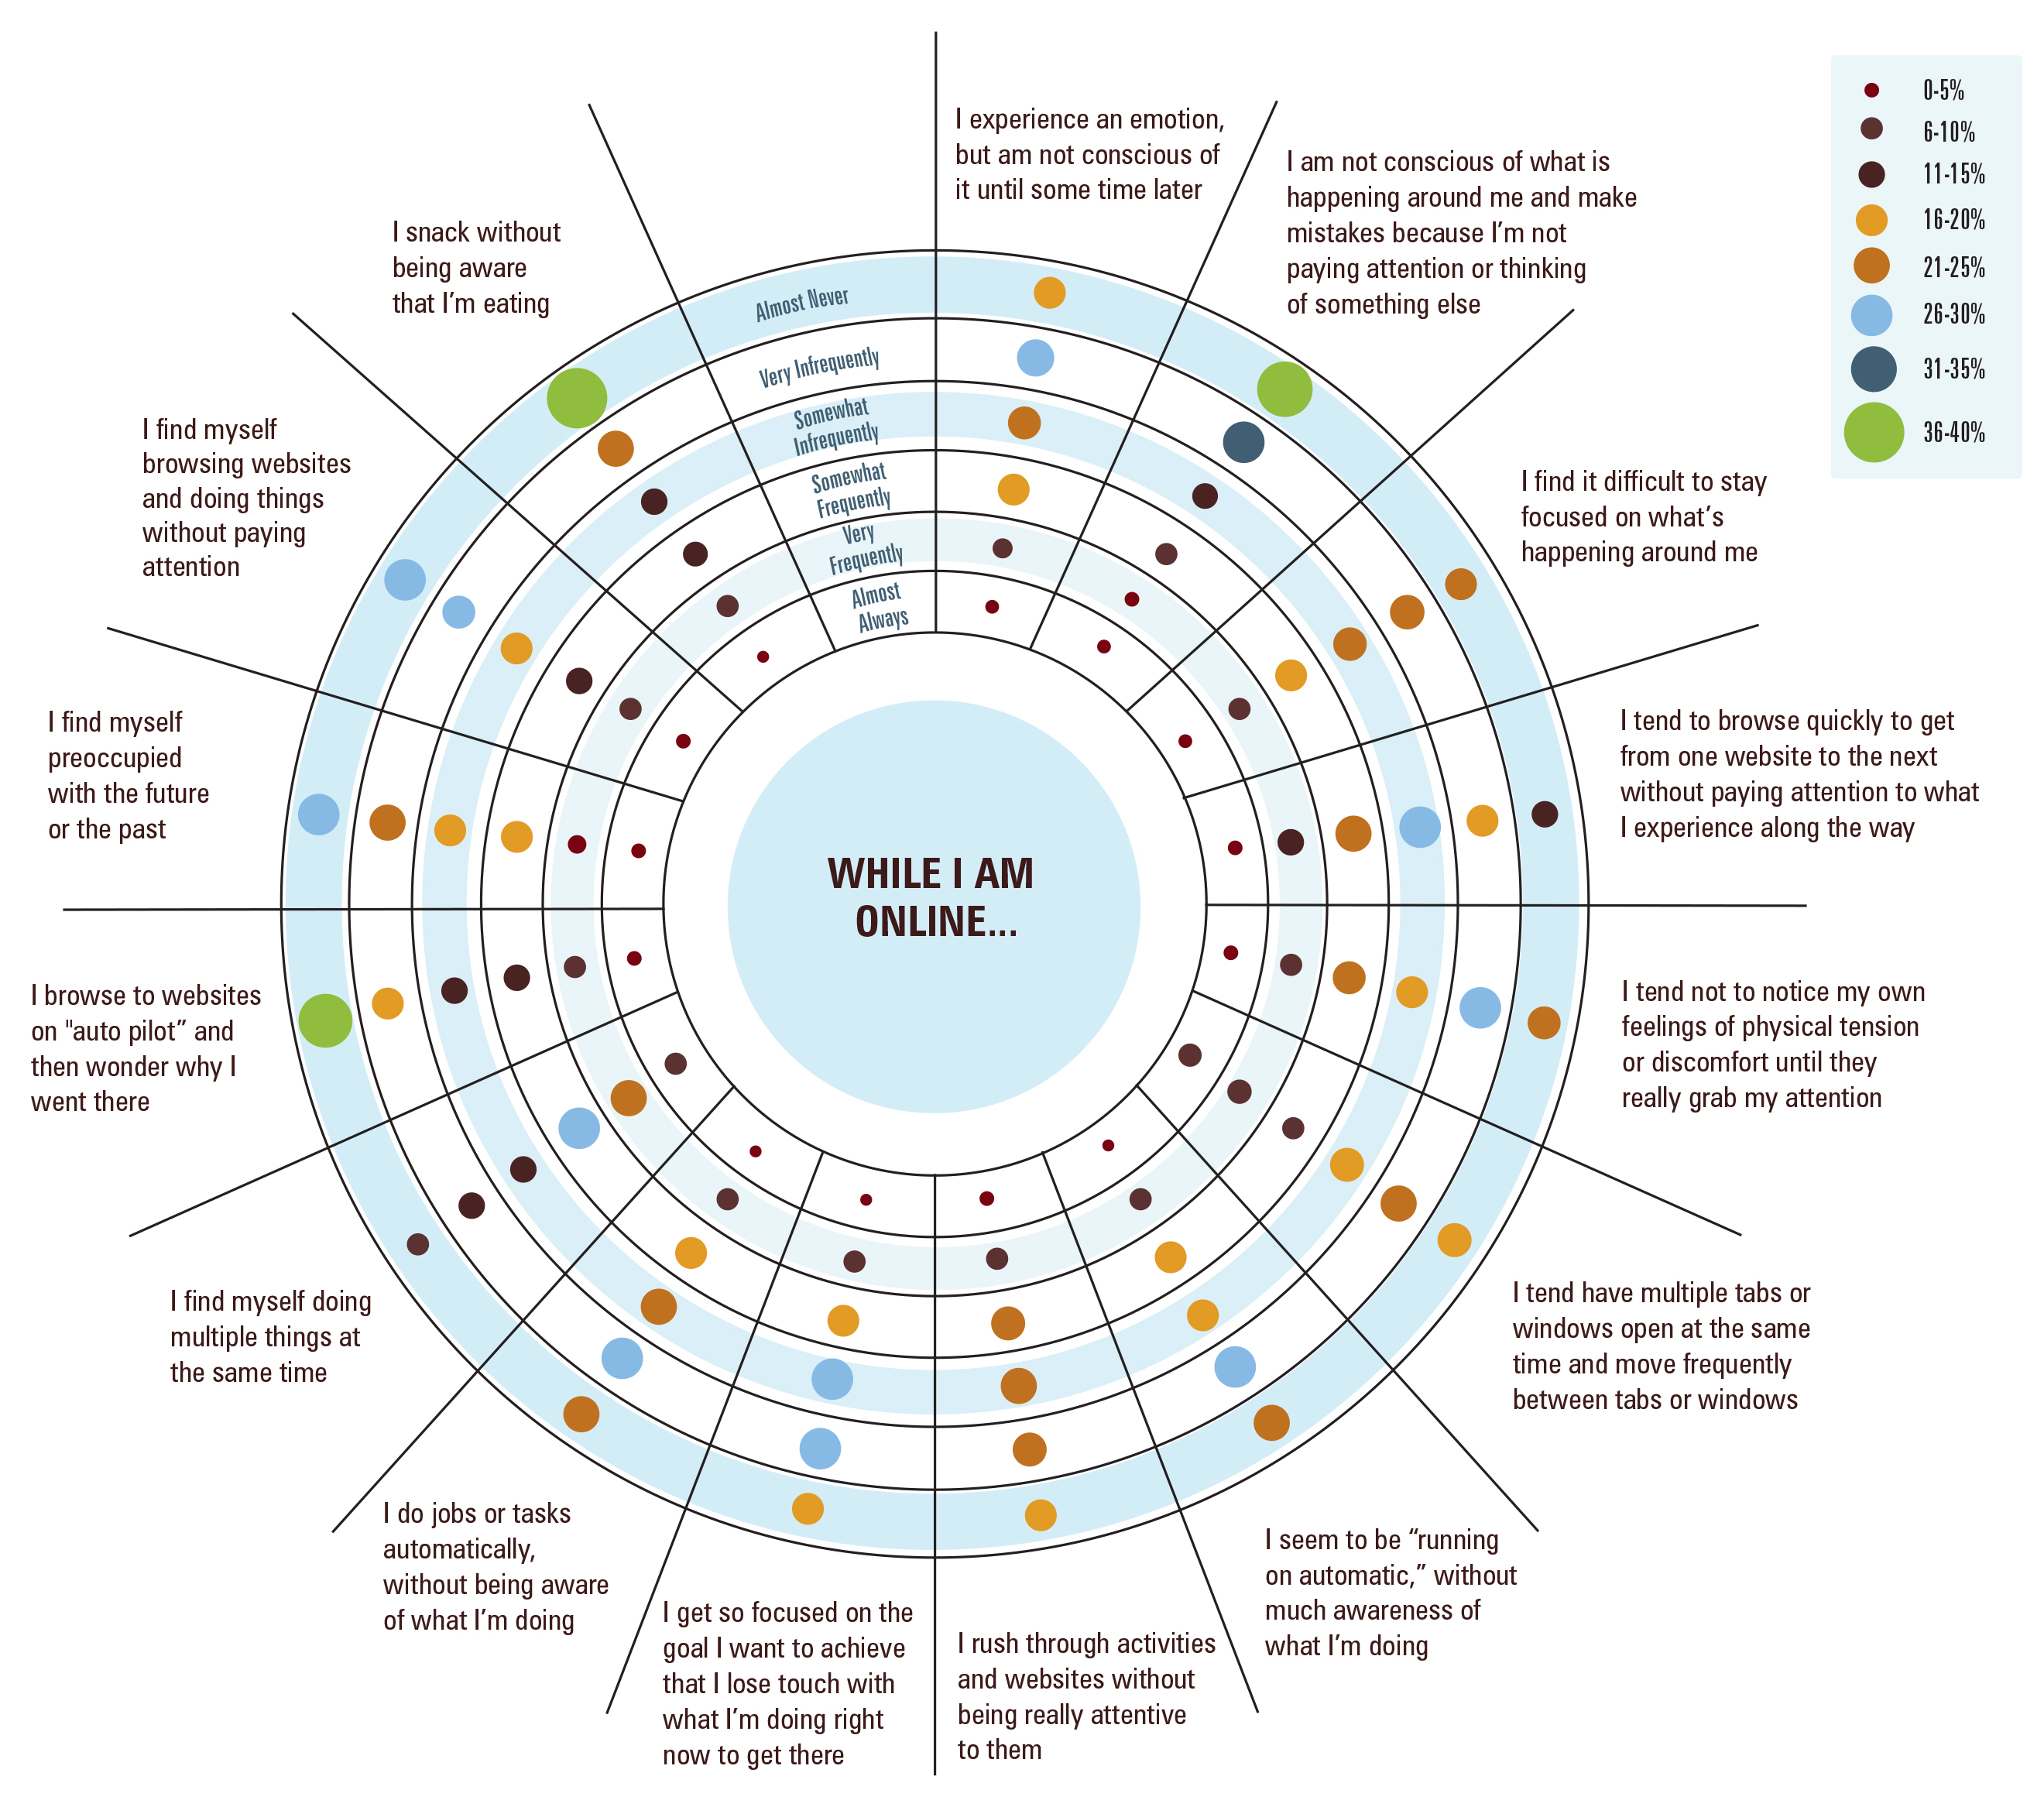
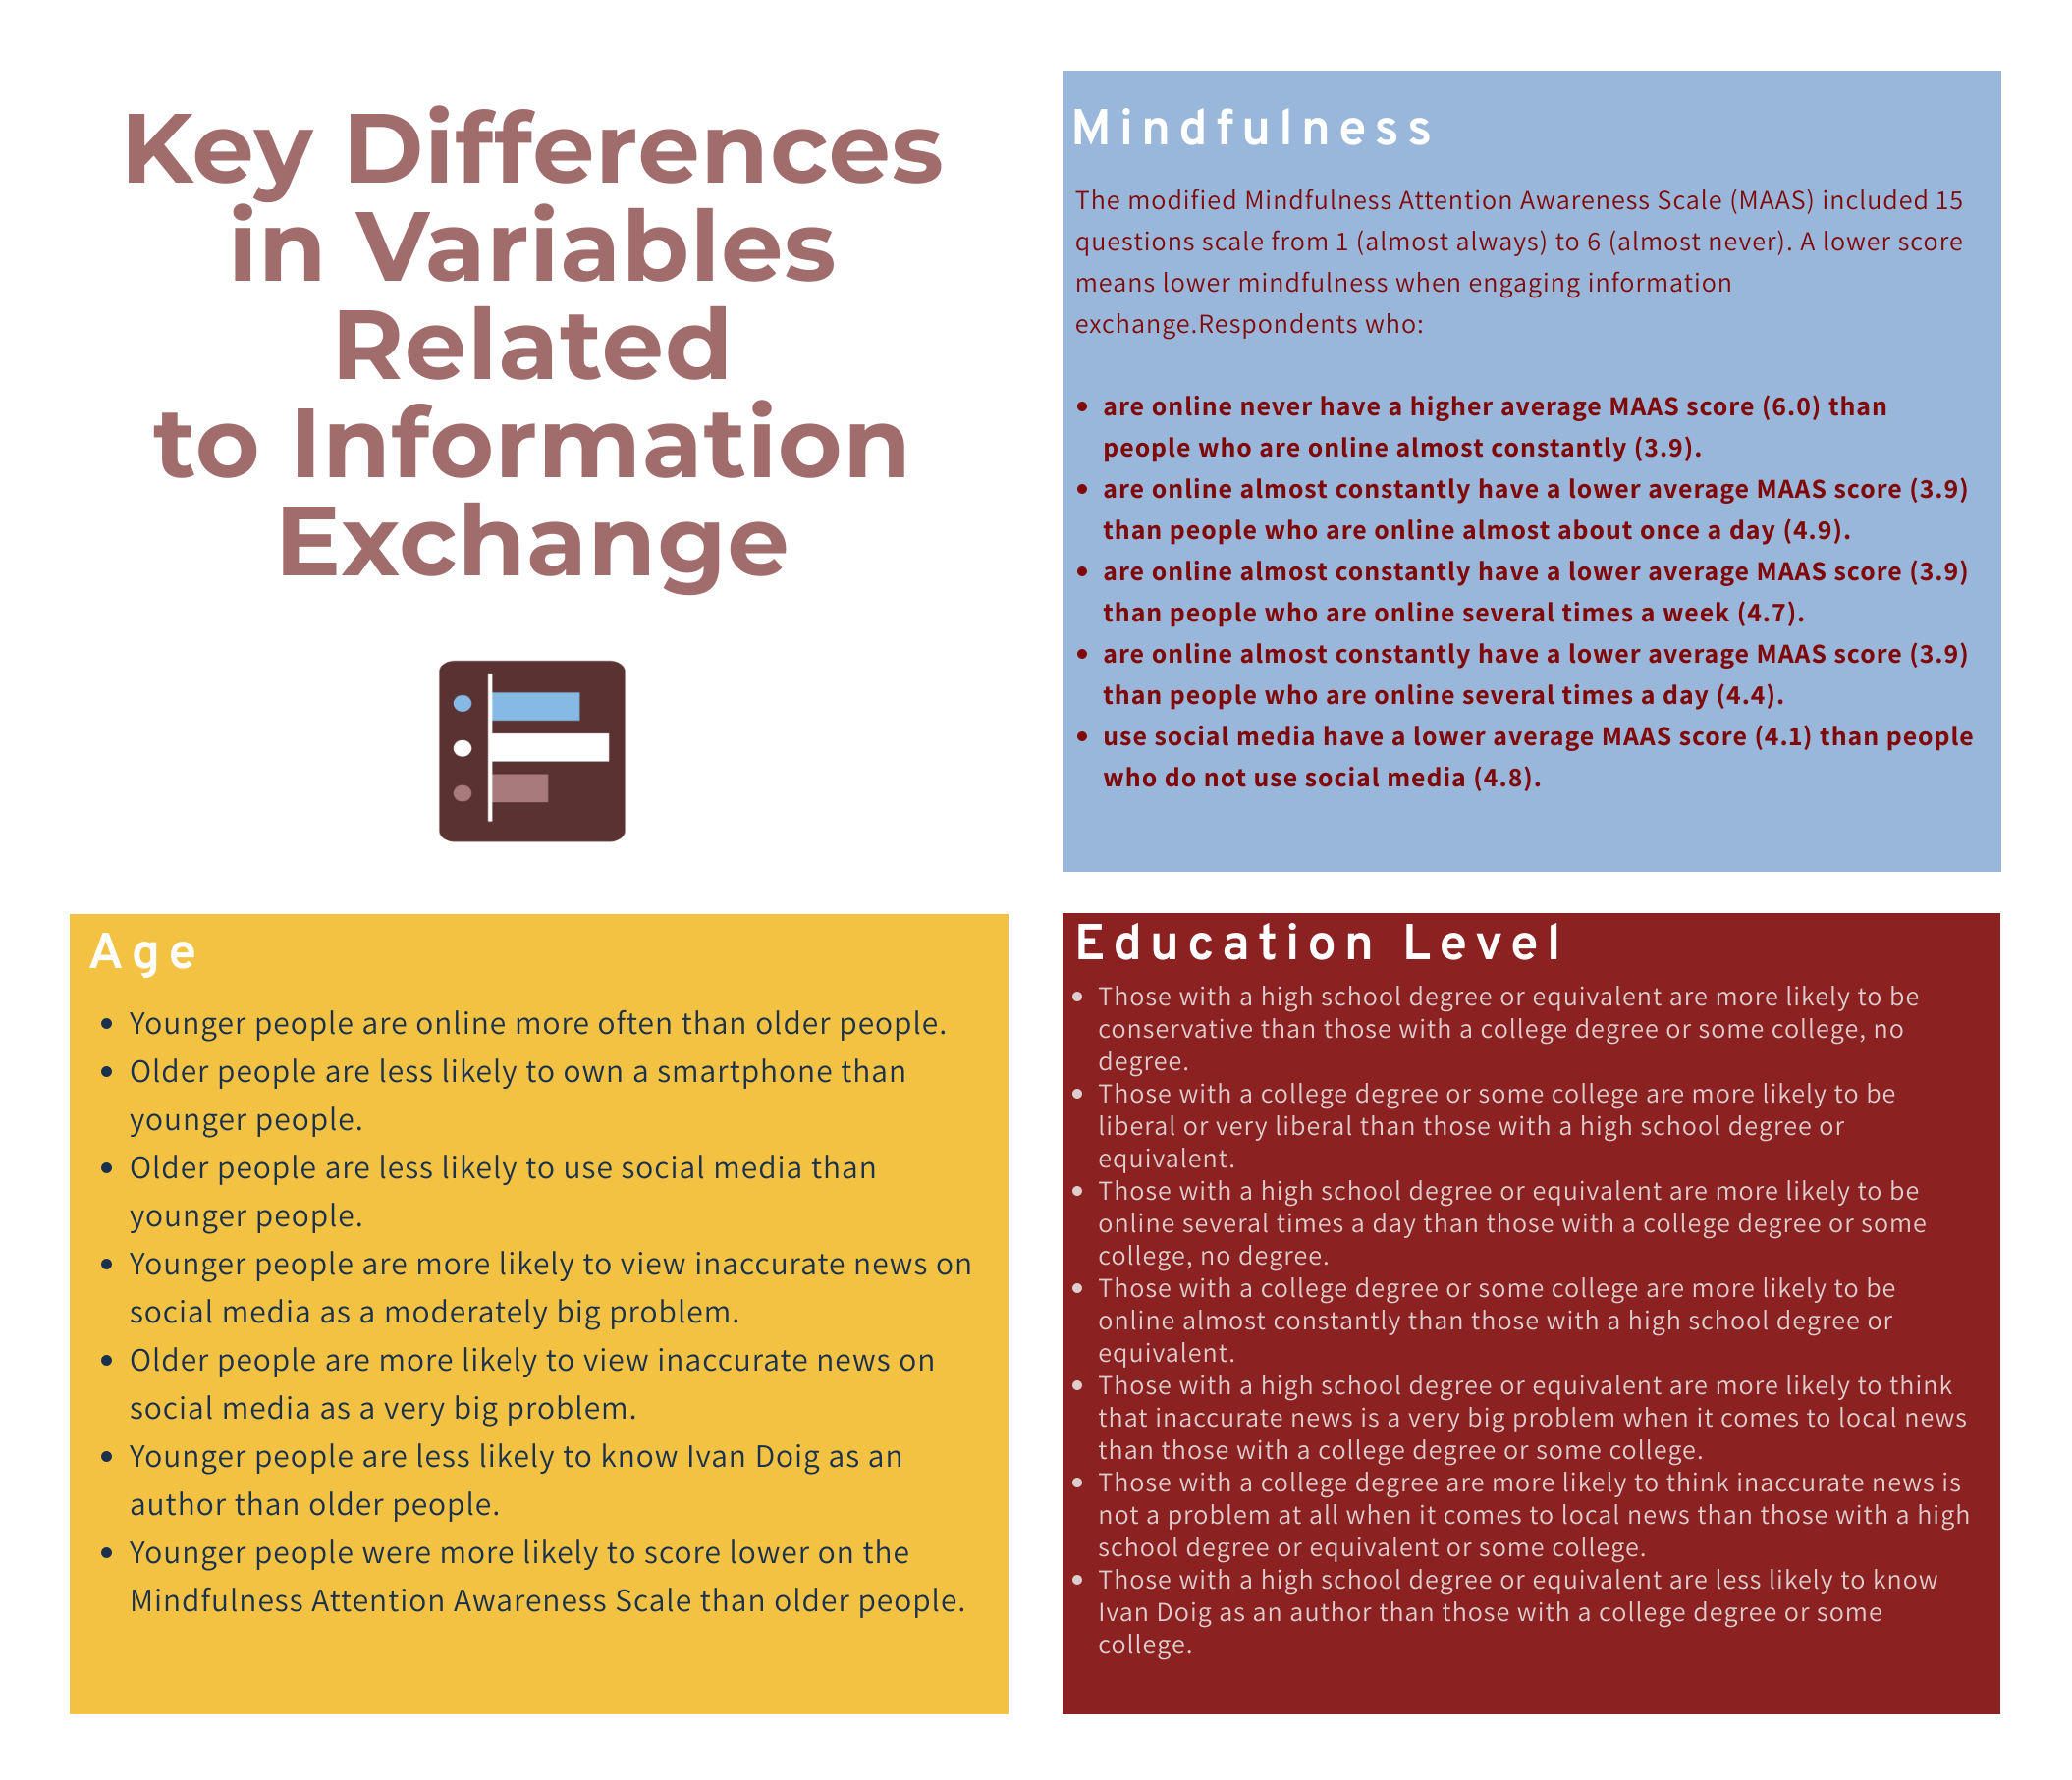
The first survey, Understanding Information Exchange in Montana During the Digital Era, was designed to examine the decision-making processes of information exchange. Survey variables included: socioeconomics; demographics; political identity; frequency of online activity; internet access; internet device type(s); social media platform use; type(s) of information sources; perceptions of levels of control, accuracy, and incivility by social media, local news, and national news; Mindfulness Attention Awareness Scale (MAAS), adapted for information exchange; knowledge of Ivan Doig; contact information.
The second supplemental survey was designed to understand how the decision-making processes of information exchange changed due to the COVID-19 pandemic. Survey variables included: socioeconomics; demographics; change in frequency of internet use; change in type(s) of information sources.
Key Findings of Understanding Information Exchange
in Montana During the Digital Era Survey
The survey was launched in early January 2020 and closed in late April 2020, with 787 total responses from Montanans (see density map of respondents). Respondents identified as: 17.3% were 18-29 years old, 48.6% were 30-49 years old, 23.5% were 50-64 years old, and 10.6% were over 65 years old; 70.9% were female, 28.1% were male, and 0.8% did not identify as female, male, or transgender; 85.5% were White, 3.1% were American Indian or Alaska Native, 1.8% were Asian; 0.3% were Black or African American, 2.3% were Hispanic or Latino, 1.8% were Other, and 3.6% were two or more races; 0.3% had less than a high school diploma, 4.4% had a high school degree or equivalent, 13.4% had some college no degree, and 81.9% had a college degree; 21.9% made less than $30,000 annually, 32.6% made $30,000 to $49,999 annually, 28.4% made $50,000 to $74,999 annually, and 17.1% made $75,000 or more annually. Highlights of these findings are visualized below.
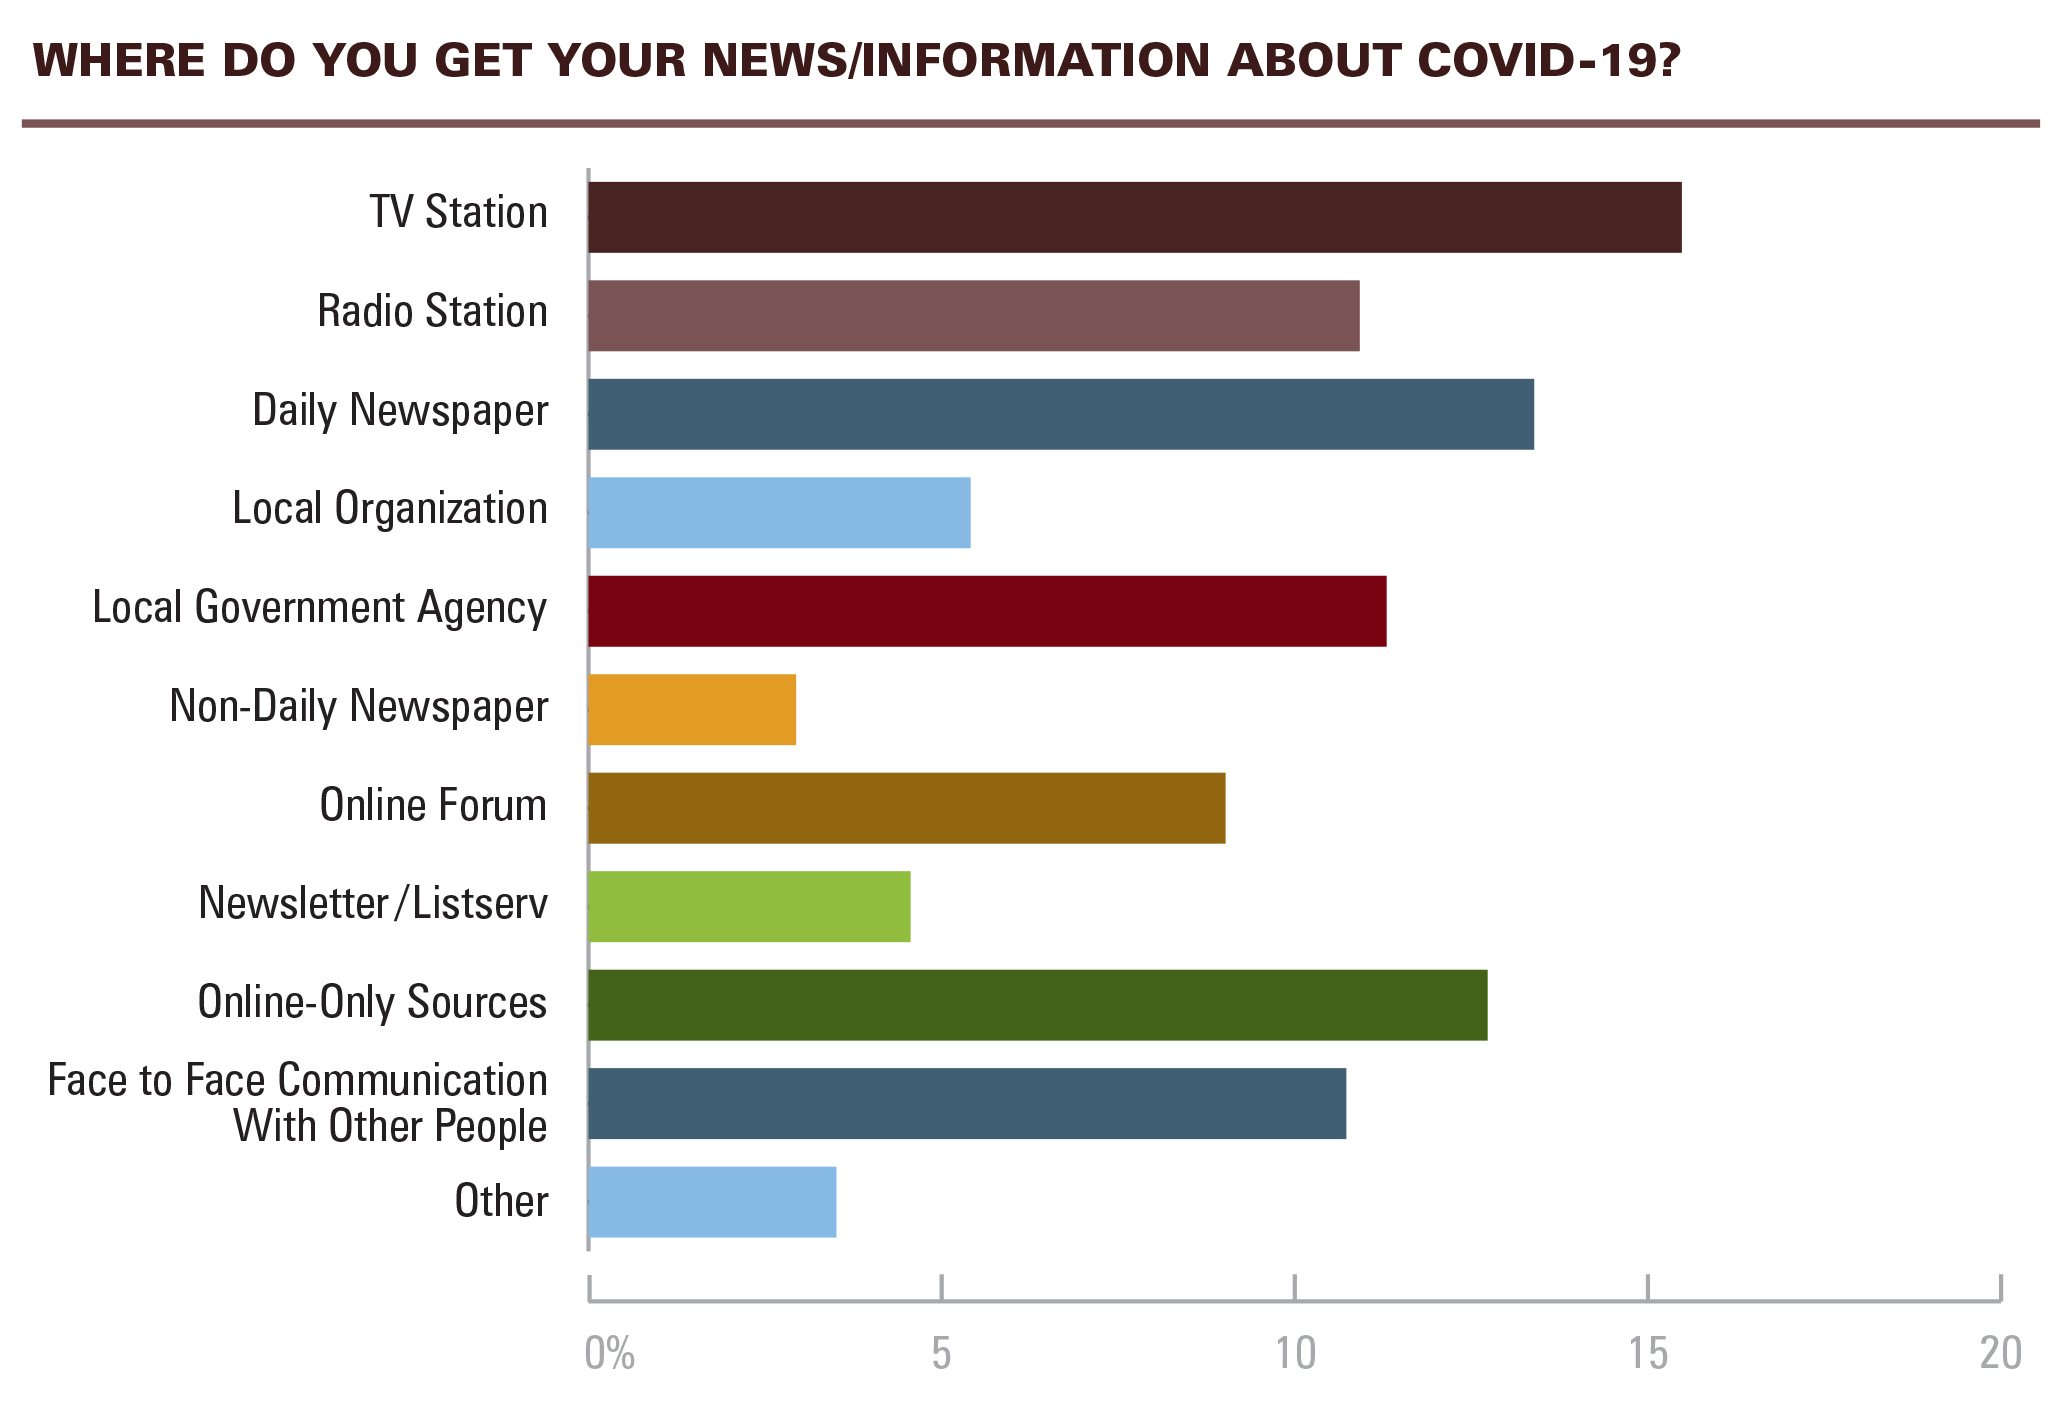
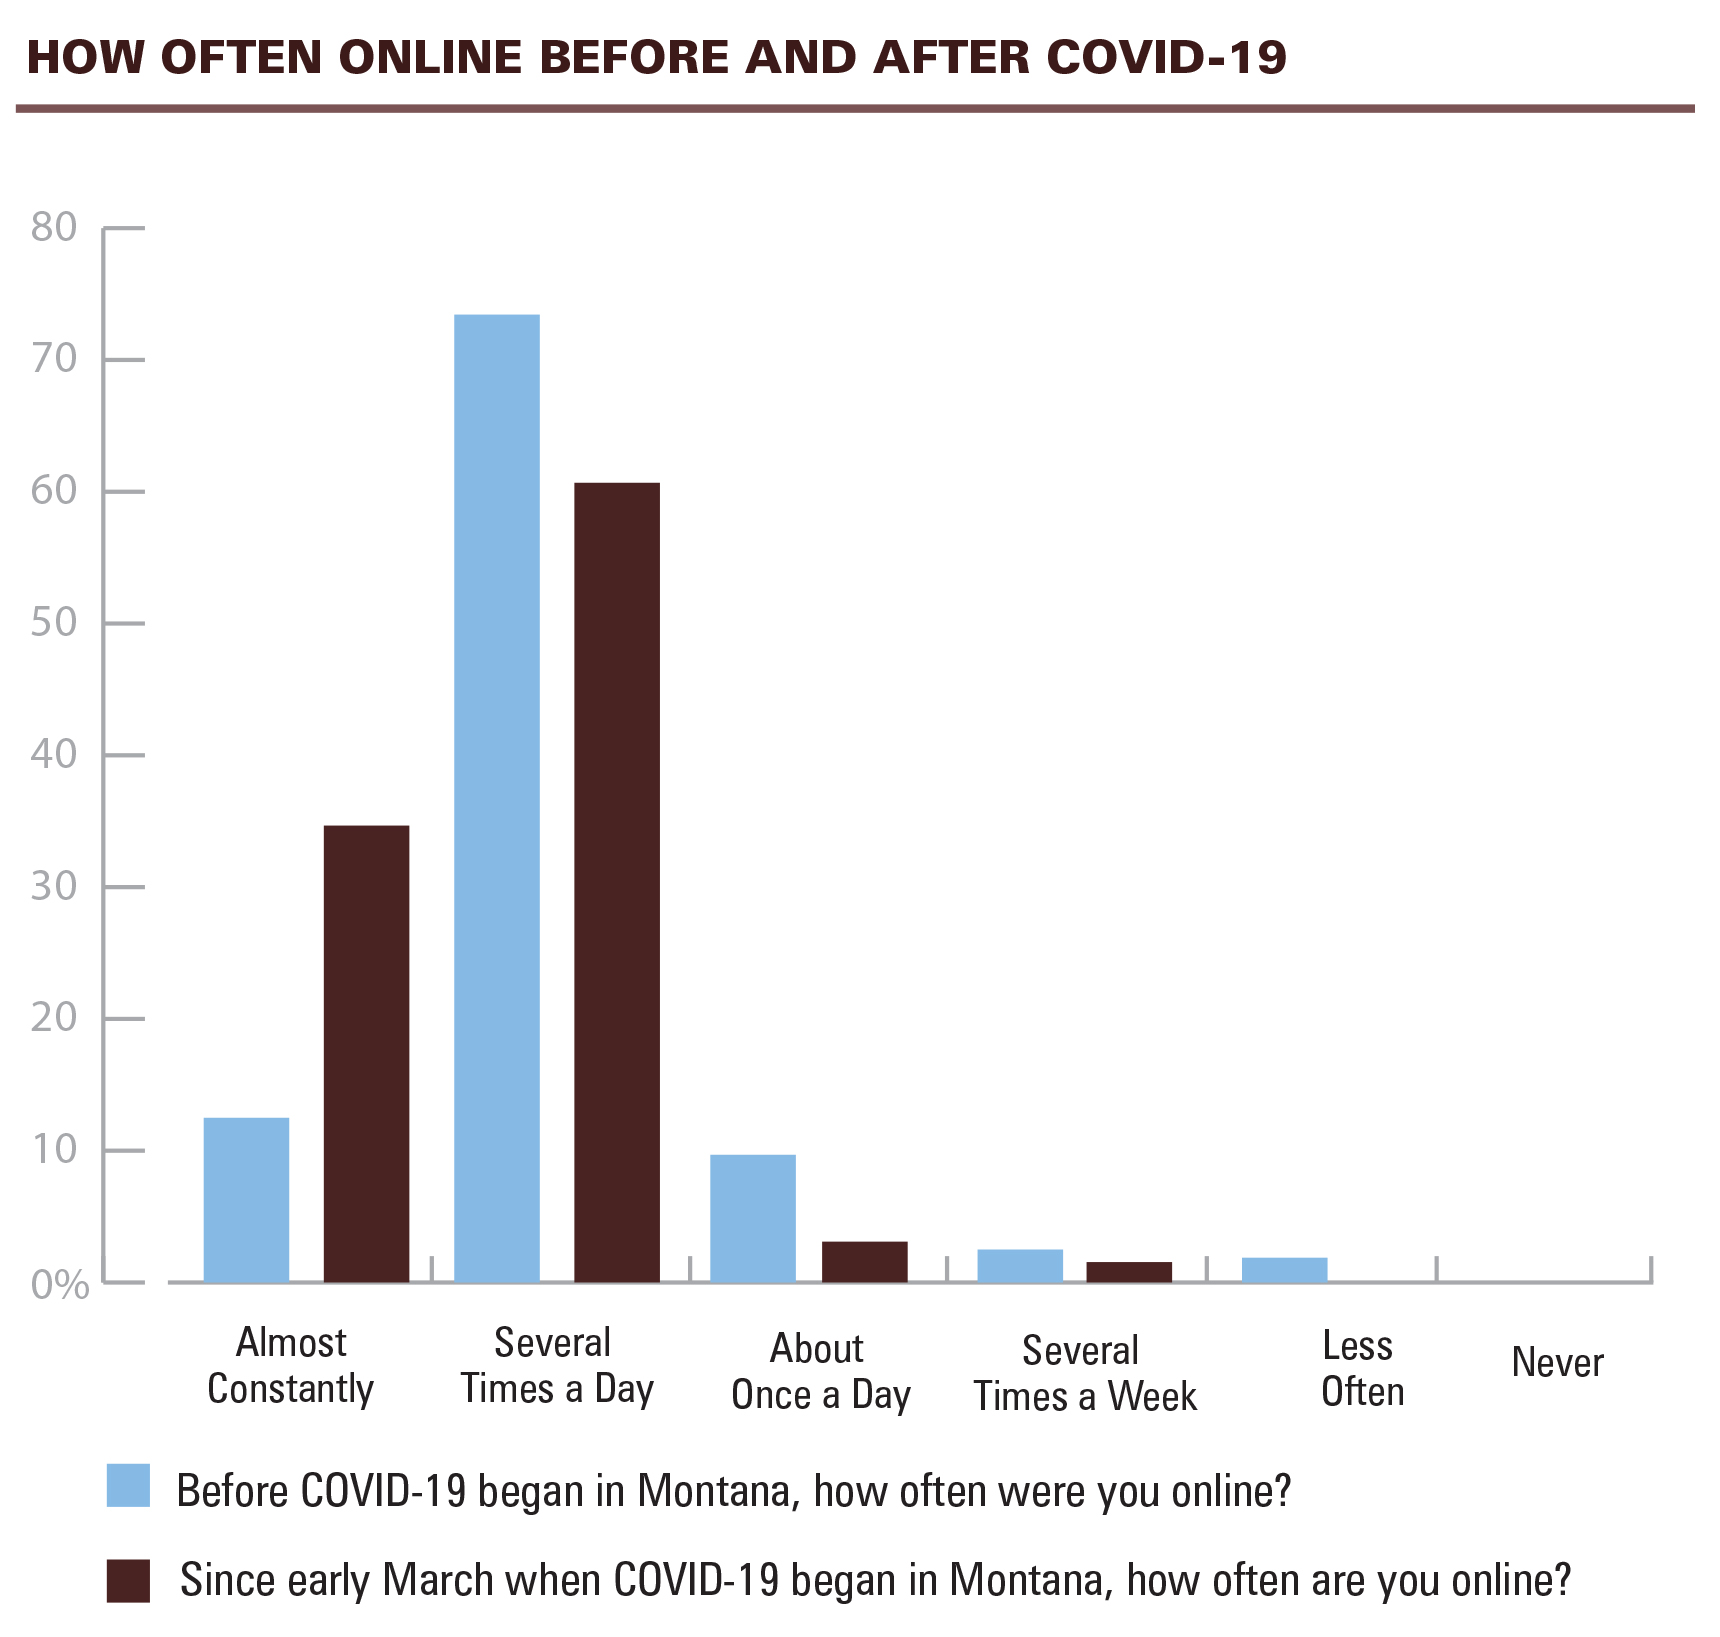
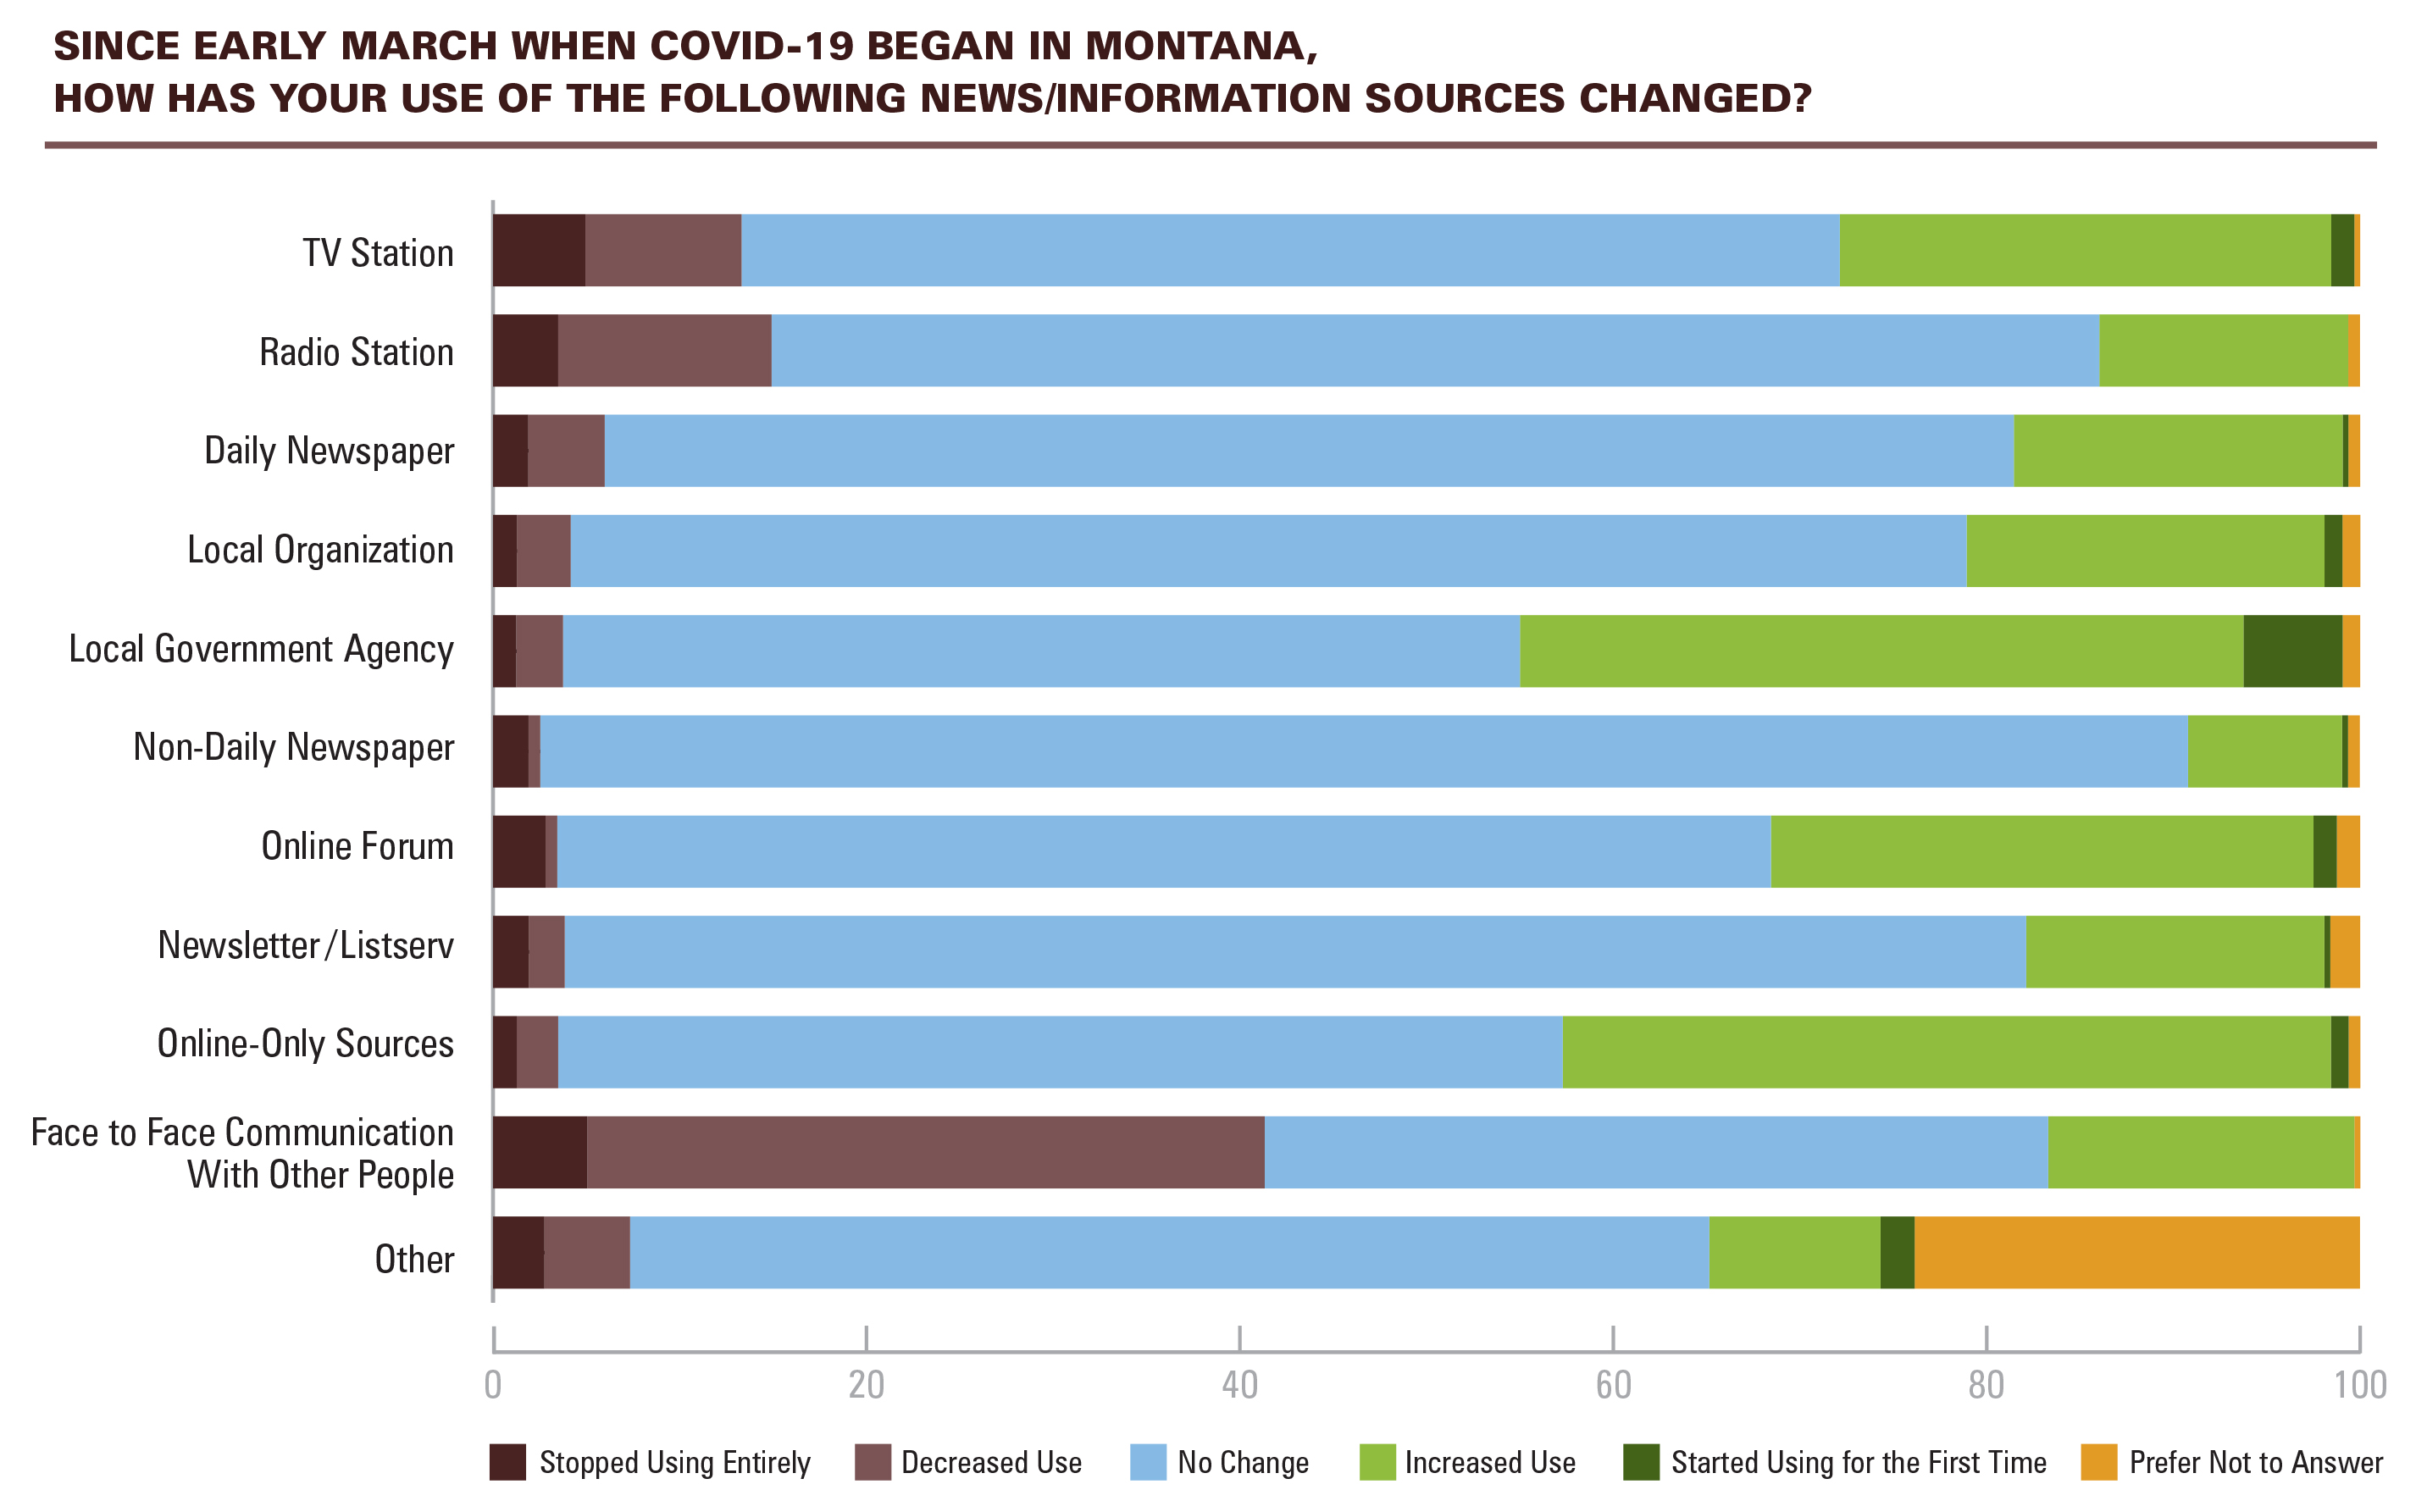
COVID-19 Survey Data
The survey was launched throughout April and May 2020 and 360 individuals from across Montana responded. Respondents identified as: 15.9% were 18-29 years old, 45.6% were 30-49 years old, 23.5% were 50-64 years old, and 13.0% were over 65 years old; 87.6% were female, 11.3% were male, 0.6% were gender queer or gender nonconfroming, 0.3% were a different identity, and 0.3% preferred not to answer; 93.2% were White, 1.1% were American Indian or Alaska Native, 0.3% were Asian; 0.3% were Black or African American, 0.8% were Hispanic or Latino, 0.6% were Other, and 3.7% were two or more races; 0.8% had less than a high school diploma, 5.6% had a high school degree or equivalent, 14.6% had some college no degree, and 78.9% had a college degree; 30.1% made less than $30,000 annually, 16.9% made $30,000 to $49,999 annually, 50.1% made $50,000 to $74,999 annually, and 2.8% made $75,000 or more annually.