
Paws to De-Stress - Past Infographics
It is amazing to see what a difference these dogs make for the students of MSU. We are proud to have had the chance to partner with Intermountain Therapy Animals over the years! These infographics are a quick glance at how our events have worked to help students De-Stress.
Jump to: 2019 2017 2016 2015 2014
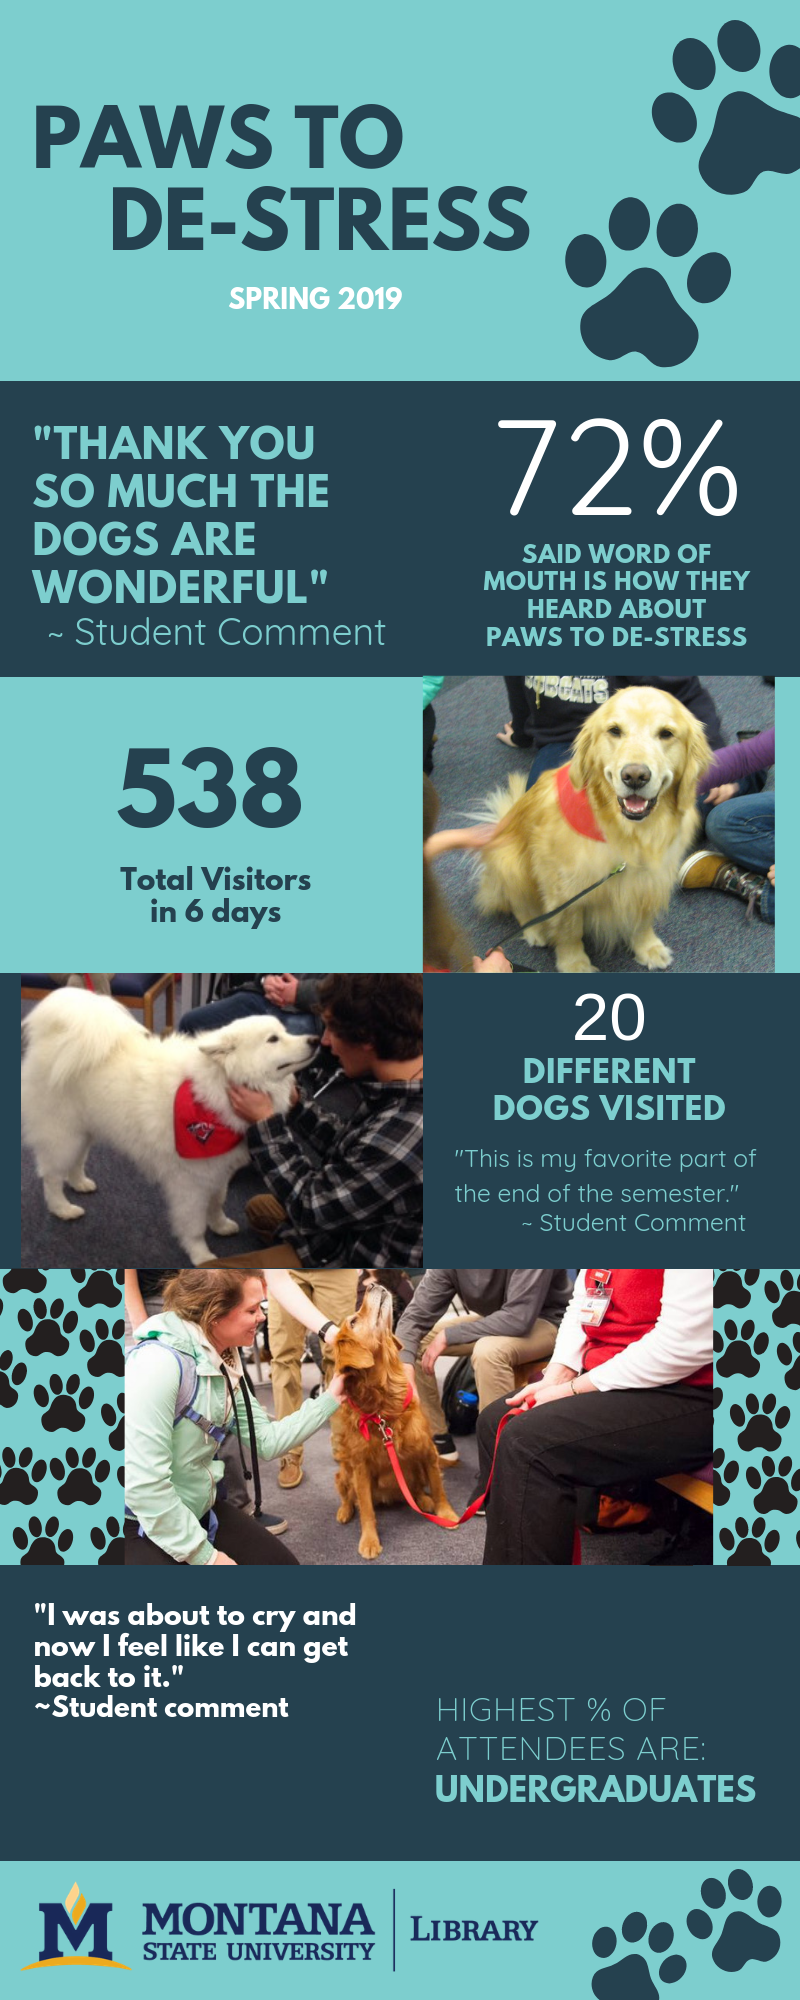
Paws to De-Stress Spring 2019 – Infographic
“Thank you so much the dogs are wonderful” – Student comment.
72% said word of mouth is how they heard about Paws to De-Stress.
538 total visitors in 6 days.
20 different dogs visited.
“This is my favorite Part of the end of the semester.” – Student comment.
“I was about to cry and now I feel like I can get back to it.” – Student comment.
Highest % of attendees are: Undergraduates.
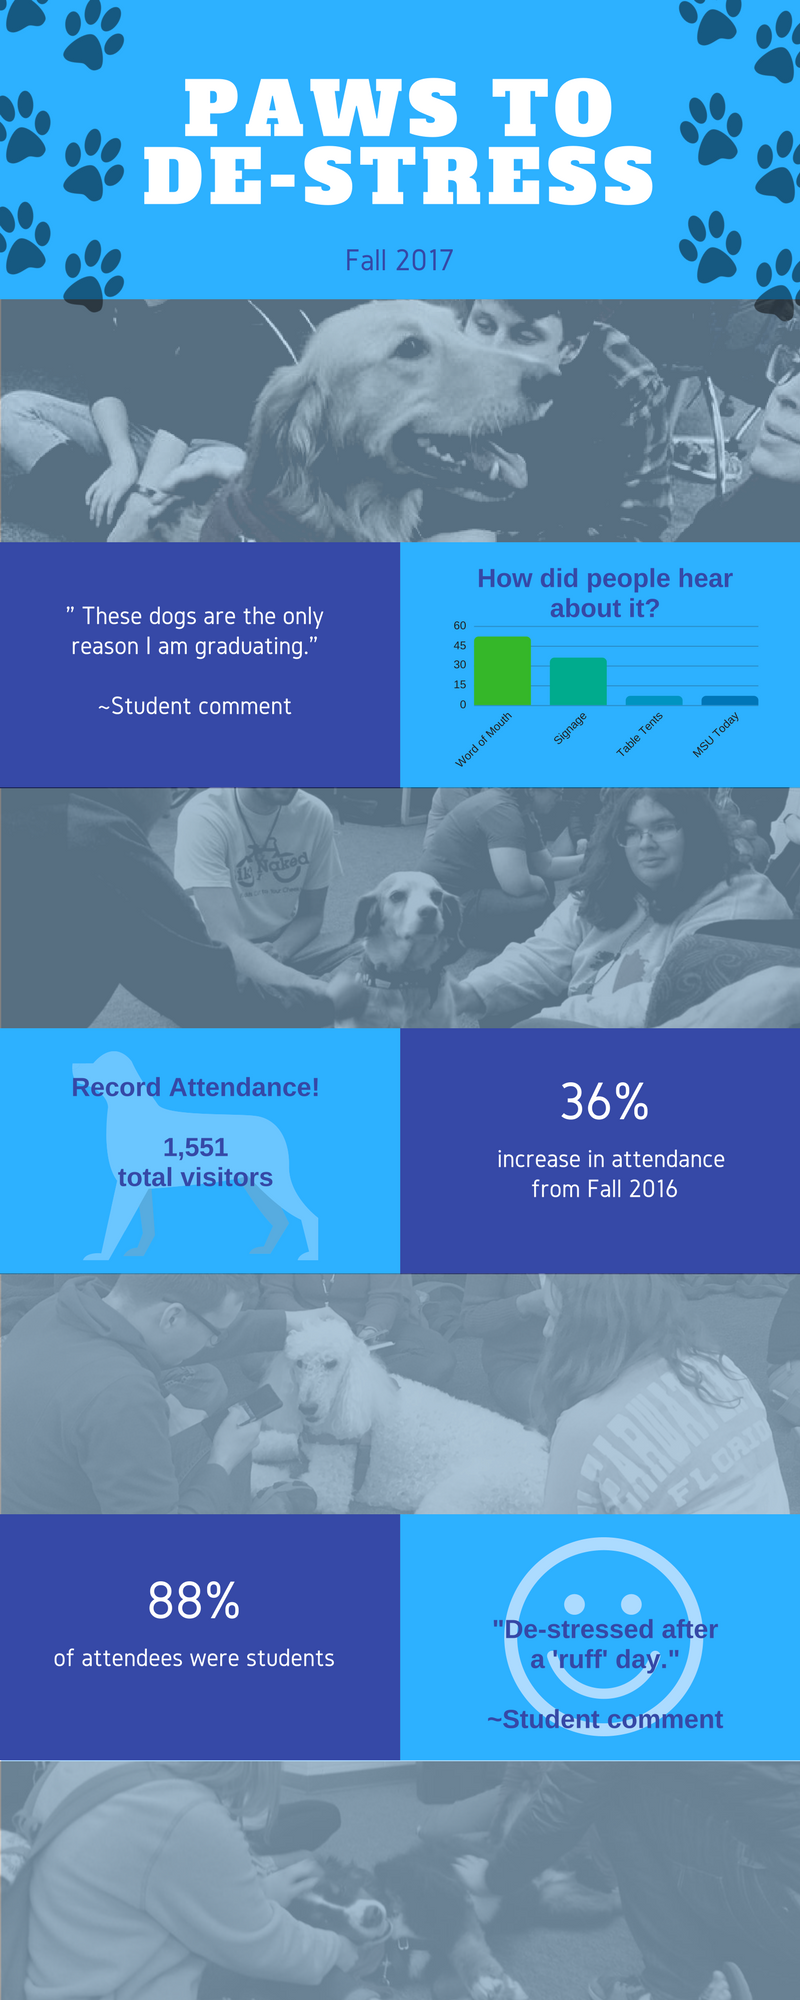
Paws to De-Stress Fall 2017 – Infographic
“These dogs are the only reason I am graduating” – Student Comment.
Graph – How did people hear about it? ~50 – Word of mouth, ~40 - Signage, ~10 – Table tents, and ~10 MSU Today.
Record attendance! 1,551 total visitors.
36% increase in attendance from Fall 2016.
88% of attendees were students.
“De-stressed after a ‘ruff’day.” – Student comment.
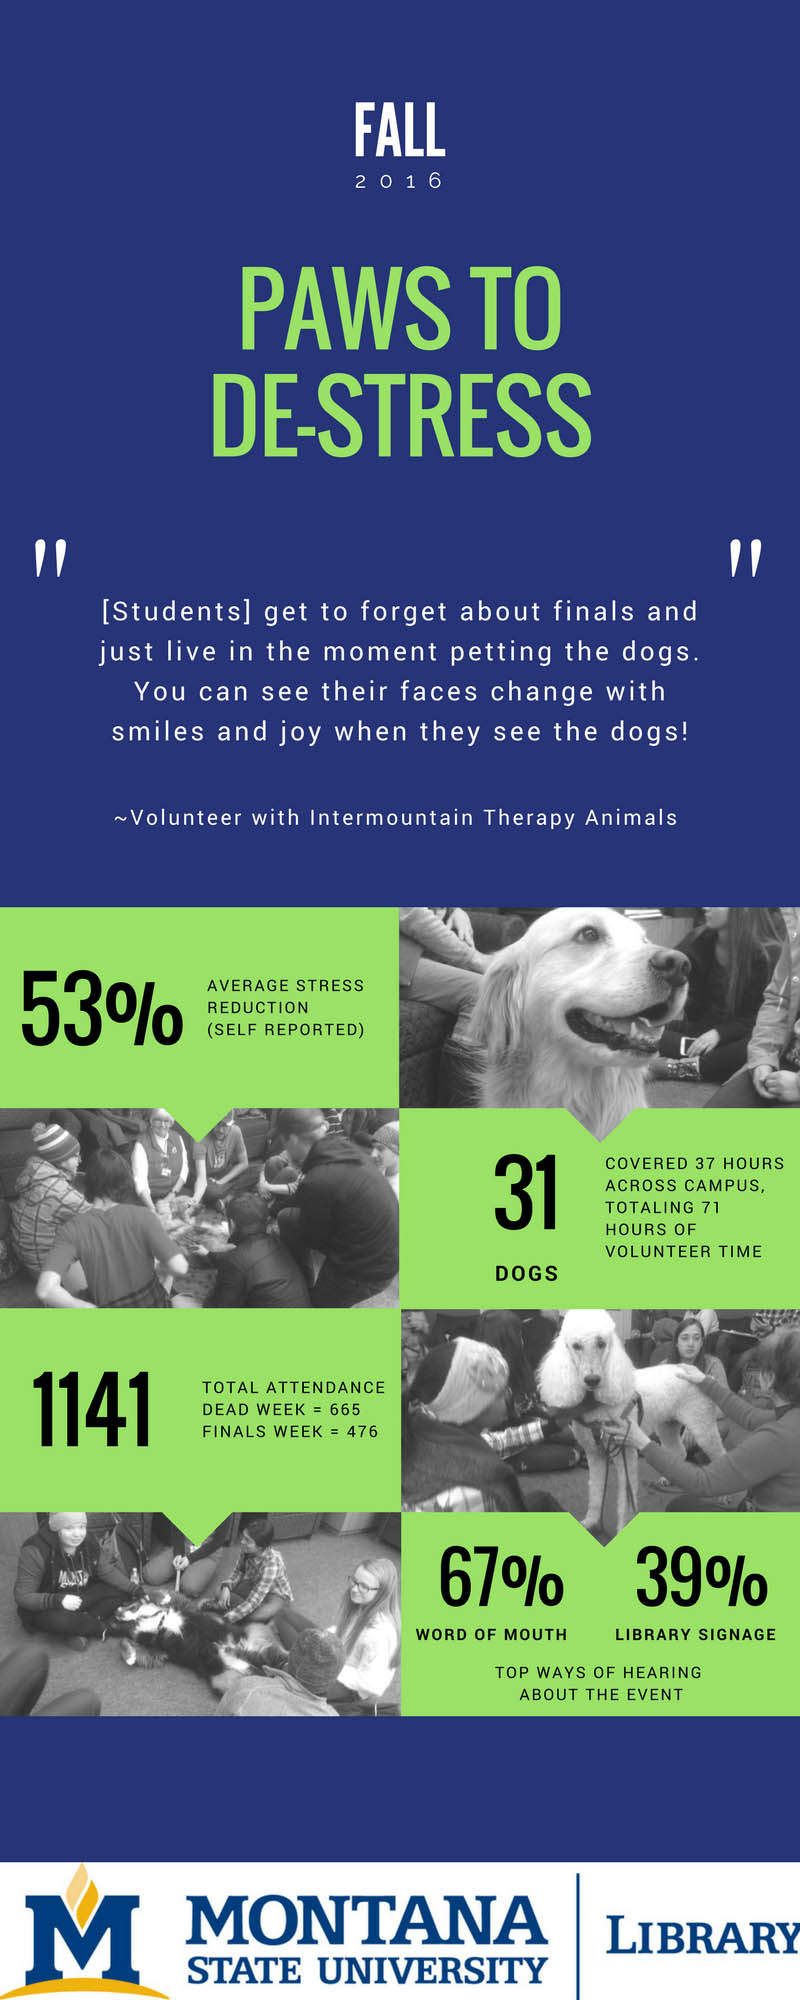
Paws to De-Stress Fall 2016 – Infographic
“[Students] get to forget about finals and just live in the moment petting the dogs. You can see their faces change with smiles and joy when they see the dogs!” – Volunteer with Intermountain Therapy Animals.
53% average stress reduction (self reported).
31 Dogs covered 37 hours across campus, totaling 71 hours of volunteer time.
1141 total attendance. Dead week = 665, Finals week =476
67% word of mouth, 39% Library Signage – Top ways of hearing about the event.
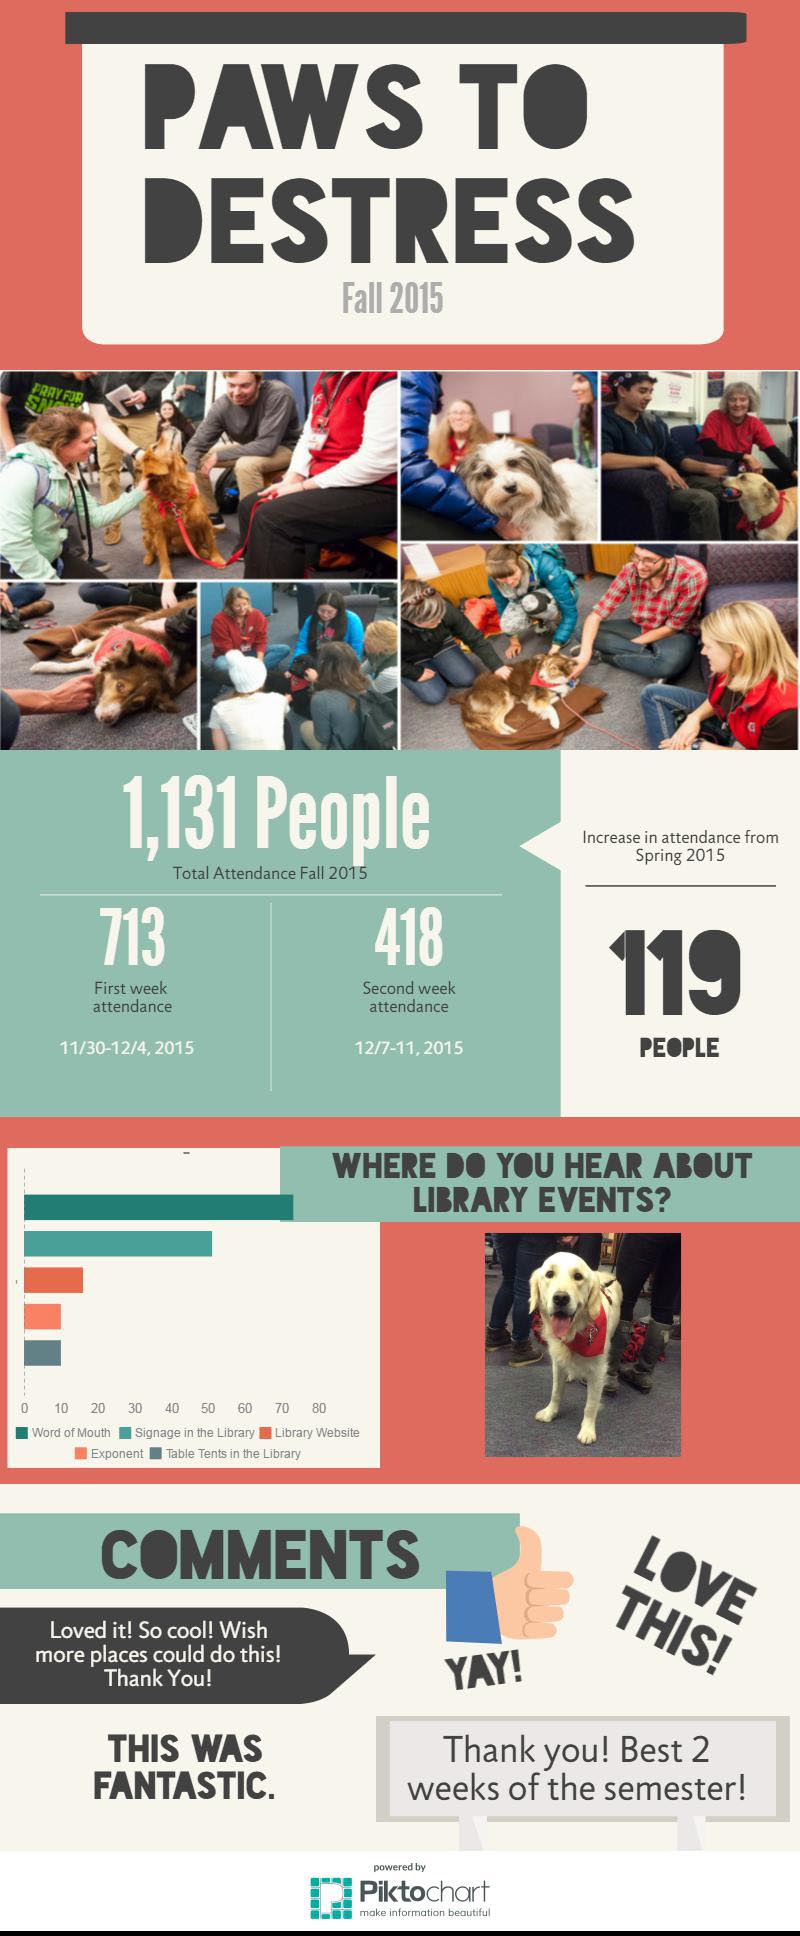
Paws to De-Stress Fall 2015 – Infographic
1131 people total attendance – Fall 2015.
713 first week attendance 11/30-12/4, 2015. 418 second week attendance 12/7-11, 2015.
Increase in attendance from Spring 2015 – 119 people.
Where do you hear about library events? Graph shows: ~75 said word of mouth, ~50 said signage in the library, ~17 said Library Website, ~10 said Exponent, ~10 said Table tents in the library.
Comments: “Love this!”, “Yay!”, “This was fantastic!”, “Loved it! So cool! Wish more places could do this! Thank you!”, “Thank you! Best 2 weeks of the semester!”
Ad – Powered by Pictochart make information beautiful
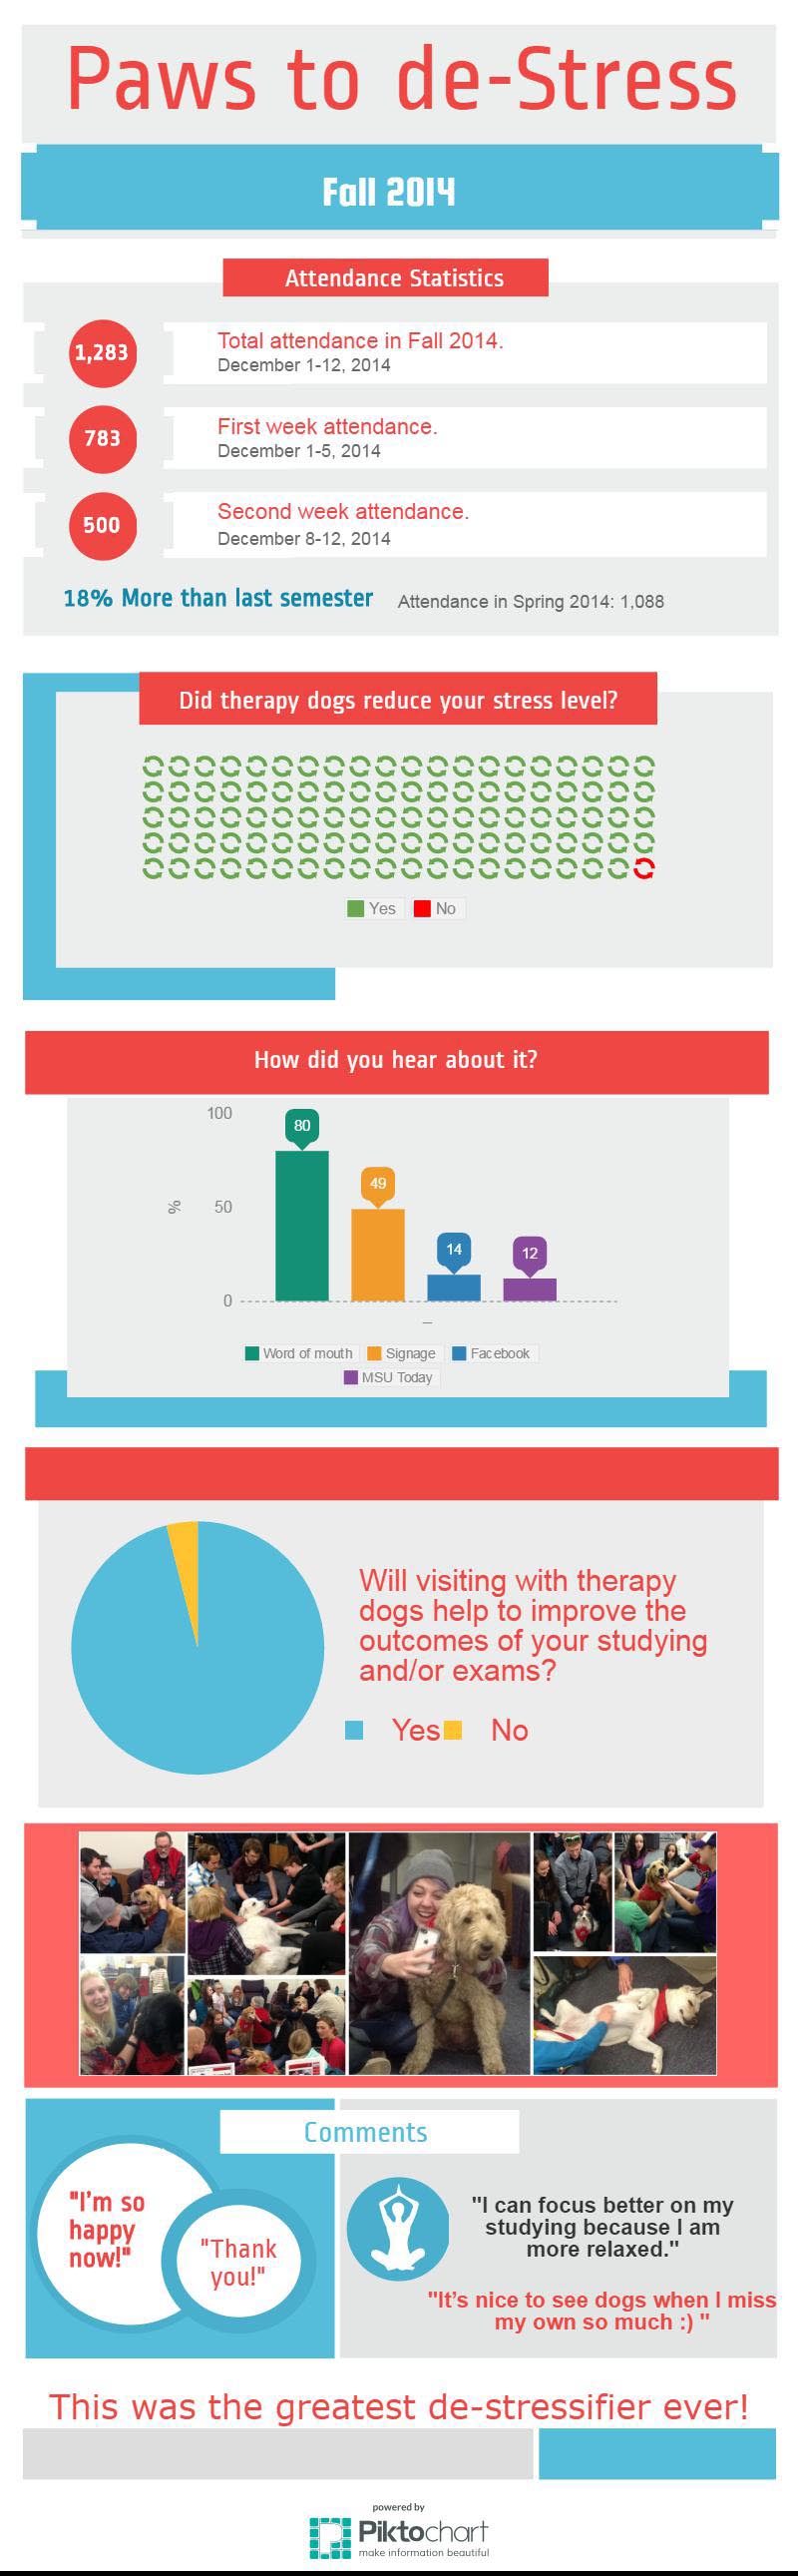
Paws to De-Stress Fall 2014 – Infographic
Attendance Statistics: 1,283 – Total attendance in fall 2014. December 1-12, 2014. 783 – First week attendance. December 1-5, 2014. Second week attendance. December 8-12, 2014. 18% more than last semester – Attendance in Spring 2014: 1,088.
Graph – Did therapy dogs reduce your stress level? ~99% said yes.
Graph – How did you hear about it? 80% - Word of mouth, 49% - Signage, 14% - Facebook, 12% - MSU Today.
Pie chart – Will visiting with therapy dogs help to improve the outcomes of your studying and/or exams? ~90% - yes ~10% - no.
Comments – “I’m so happy now!”, “Thank you!”, “I can focus better on my studying because I am more relaxed.” “It’s nice to see dogs when I miss my own so much :)”, “This was the greatest de-stressifier ever!”
Ad – Powered by Pictochart make information beautiful