The information on this page is no longer being updated as of Spring 2023. For questions about historical assessment data or future plans for the library dashboards, please contact Scott Young, UX & Assessment Librarian, scott.young6@montana.edu


The Library continually assesses and improves our services and collections. 

The assessment dashboards below show the range of activity of the MSU Library.


Services

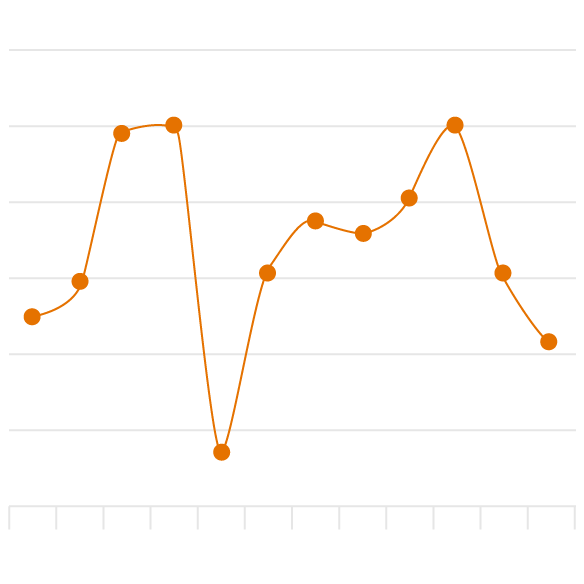
line chart

Website, Spaces, Instruction

Dashboards showing activity for the library website, library spaces, and instruction and reference.


Grants

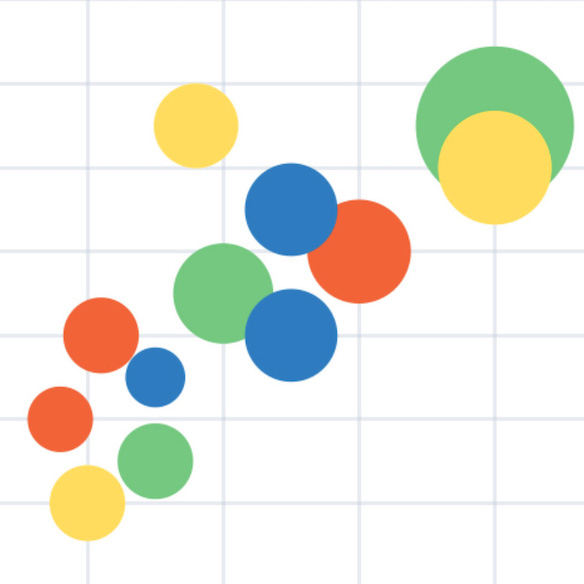
bubble chart

Grants Assessment

Dashboards showing grants awarded to the library—how many, how much, and which funders. 

Collections

bar chart

Library Collections

Dashboards showing library holdings and collection usage.


Strategy

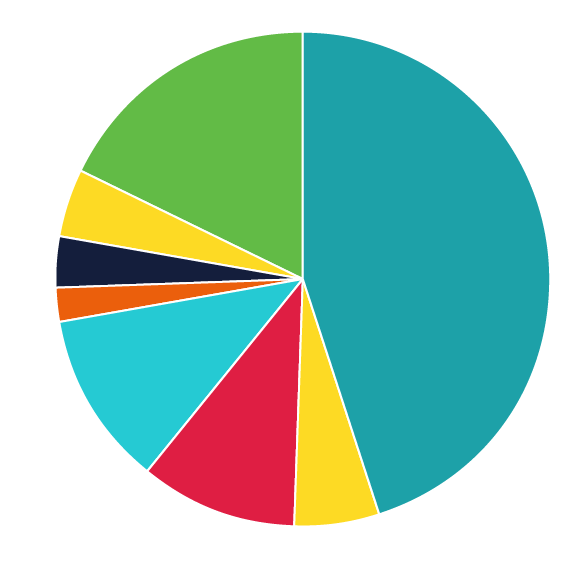
pie chart

Strategic Planning

Dashboards showing progress toward MSU Library strategic objectives


OER

area chart

Open Educational Resources

Dashboards showing rates of adoption and students savings


Community Outreach

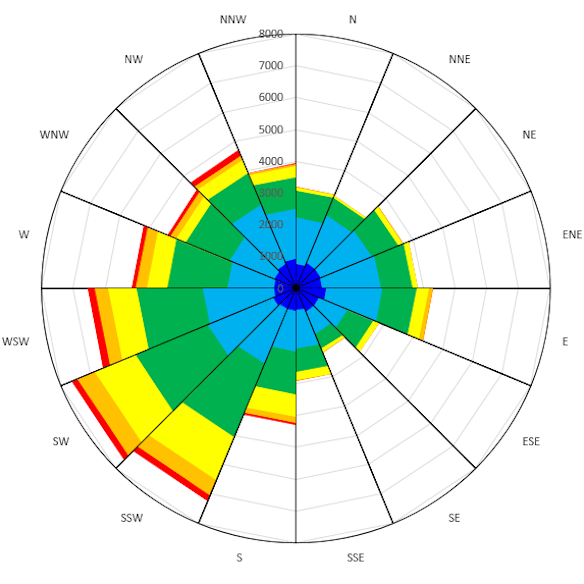
radar chart

Programs and Outreach

Dashboards showing activity related to community programs and outreach


For questions or feedback about the data presented in these dashboards, contact Scott Young, User Experience & Assessment Librarian.